The independent resource on global security
9. International arms transfers and developments in arms production
Contents
Overview, Siemon T. Wezeman [PDF]
I. Developments among the suppliers of major arms, 2015–19, Siemon T. Wezeman, Alexandra Kuimova, Diego Lopes da Silva, Nan Tian and Pieter D. Wezeman [PDF]
II. Developments among the recipients of major arms, 2015–19, Siemon T. Wezeman, Alexandra Kuimova, Diego Lopes da Silva, Nan Tian and Pieter D. Wezeman [PDF]
III. Transparency in arms transfers, Mark Bromley and Siemon T. Wezeman [PDF]
IV. The financial value of states’ arms exports, Pieter D. Wezeman and Mark Bromley [PDF]
VI. The 100 largest arms-producing and military service companies, 2018, Aude Fleurant, Alexandra Kuimova, Diego Lopes da Silva, Nan Tian, Pieter D. Wezeman and Siemon T. Wezeman [PDF]
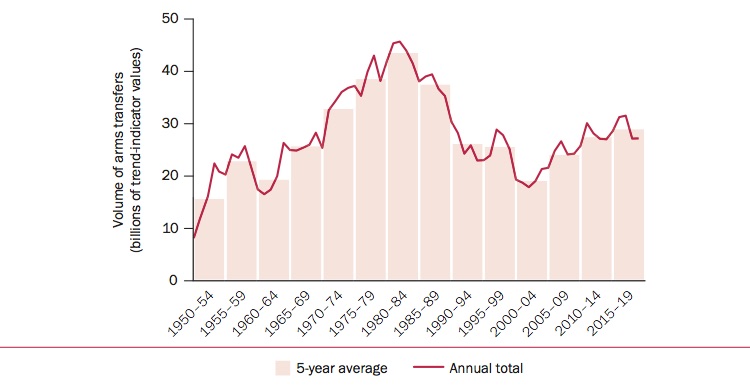
The volume of international transfers of major arms grew by 5.5 per cent between 2010–14 and 2015–19, reaching its highest level since the end of the cold war. This growth is a continuation of the steady upward trend that began in the early 2000s. However, the total volume for 2015–19 was still 33 per cent lower than
the total for 1980–84, when arms transfers peaked.
Importers of major arms
SIPRI identified 160 states as importers of major arms in 2015–19. The five largest arms importers were Saudi Arabia, India, Egypt, Australia and China, which together accounted for 36 per cent of total arms imports. The region that received the largest volume of major arms supplies in 2015–19 was Asia and Oceania, accounting for 41 per cent of the total, followed by the Middle East, which received 35 per cent—a higher share than in any of the 13 other consecutive five-year periods since
1950–54. The flow of arms to two regions increased between 2010–14 and 2015–19—the Middle East (61 per cent) and Europe (3.2 per cent)—while flows to the other three regions decreased—the Americas (–40 per cent), Africa (–16 per cent) and Asia and Oceania (–7.9 per cent).
The trend in transfers of major arms, 1950–2019
Suppliers of major arms
The five largest suppliers in 2015–19—the United States, Russia, France, Germany and China—accounted for 76 per cent of the total volume of exports. Since 1950, the USA and Russia (or the Soviet Union before 1992) have consistently been by far the largest suppliers. In 2015–19 US arms exports accounted for 36 per cent of the global total and were 23 per cent higher than in 2010–14. By far the largest recipient of US arms in 2015–19 was Saudi Arabia, which received 25 per cent of US arms exports, up from 7.4 per cent in 2010–14. In contrast, Russian arms exports decreased by 18 per cent and its share of the global total dropped from 27 per cent in 2010–14 to 21 per cent in 2015–19. Arms exports by the three other largest suppliers—France (72 per cent), Germany (17 per cent) and China (6.3 per cent)—all increased between 2010–14 and 2015–19.
The top 10 list of suppliers has histor-ically been dominated by the USA, Russia and West European suppliers, and has generally only included suppliers that had previously appeared among the top 10. In 2015–19, South Korea was the first state in decades to become a top 10 supplier having never been one before. Many of the 68 states identified by SIPRI as exporters of major arms in 2015–19 are small exporters. The states in the top 25 supplied 99 per cent of total exports. States in North America and Europe (including Russia) accounted for 87 per cent of all arms exports.
Transparency in arms transfers
The number of states reporting their arms exports and imports to the United Nations Register of Conventional Arms (UNROCA) remained at a low level and no major changes occurred in the various national and regional reporting instruments. The number of states fulfilling their treaty obligation under the 2013 Arms Trade Treaty (ATT) to report arms exports and imports has grown: from 53 for 2016 to 61 for 2018*. However, as more states have ratified the ATT, the proportion of states parties submitting a report has fallen: from 71 per cent for 2016 to 66 per cent for 2018.
The financial value of states’ arms exports
While SIPRI data on arms transfers does not represent their financial value, many arms-exporting states do publish figures on the financial value of their arms exports. Based on such data, SIPRI estimates that the total value of the global arms trade was at least $95 billion in 2017*.
Arms production and military services
The SIPRI Top 100 list of arms-producing and military services companies ranks the largest companies in the arms industry (outside China) by their arms sales, both domestic and for export. The total value of the arms sales of the SIPRI Top 100 in 2018* was $420 billion, a 4.6 per cent increase compared with 2017. The growth in arms sales was mainly attributable
to companies based in the USA, which dominate the SIPRI Top 100.
English