The independent resource on global security
5. International arms transfers and developments in arms production
Contents
Overview, Siemon T. Wezeman and Aude Fleurant [PDF]
I. Developments in arms transfers, 2017, Siemon T. Wezeman, Aude Fleurant, Alexandra Kuimova, Nan Tian and Pieter D. Wezeman [PDF]
II. Transparency in arms transfers, Mark Bromley and Siemon T. Wezeman [PDF]
III. The financial value of state's arms exports, Mark Bromley and Johanna Trittenbach [PDF]
IV. Arms production and military services, Aude Fleurant and Nan Tian [PDF]
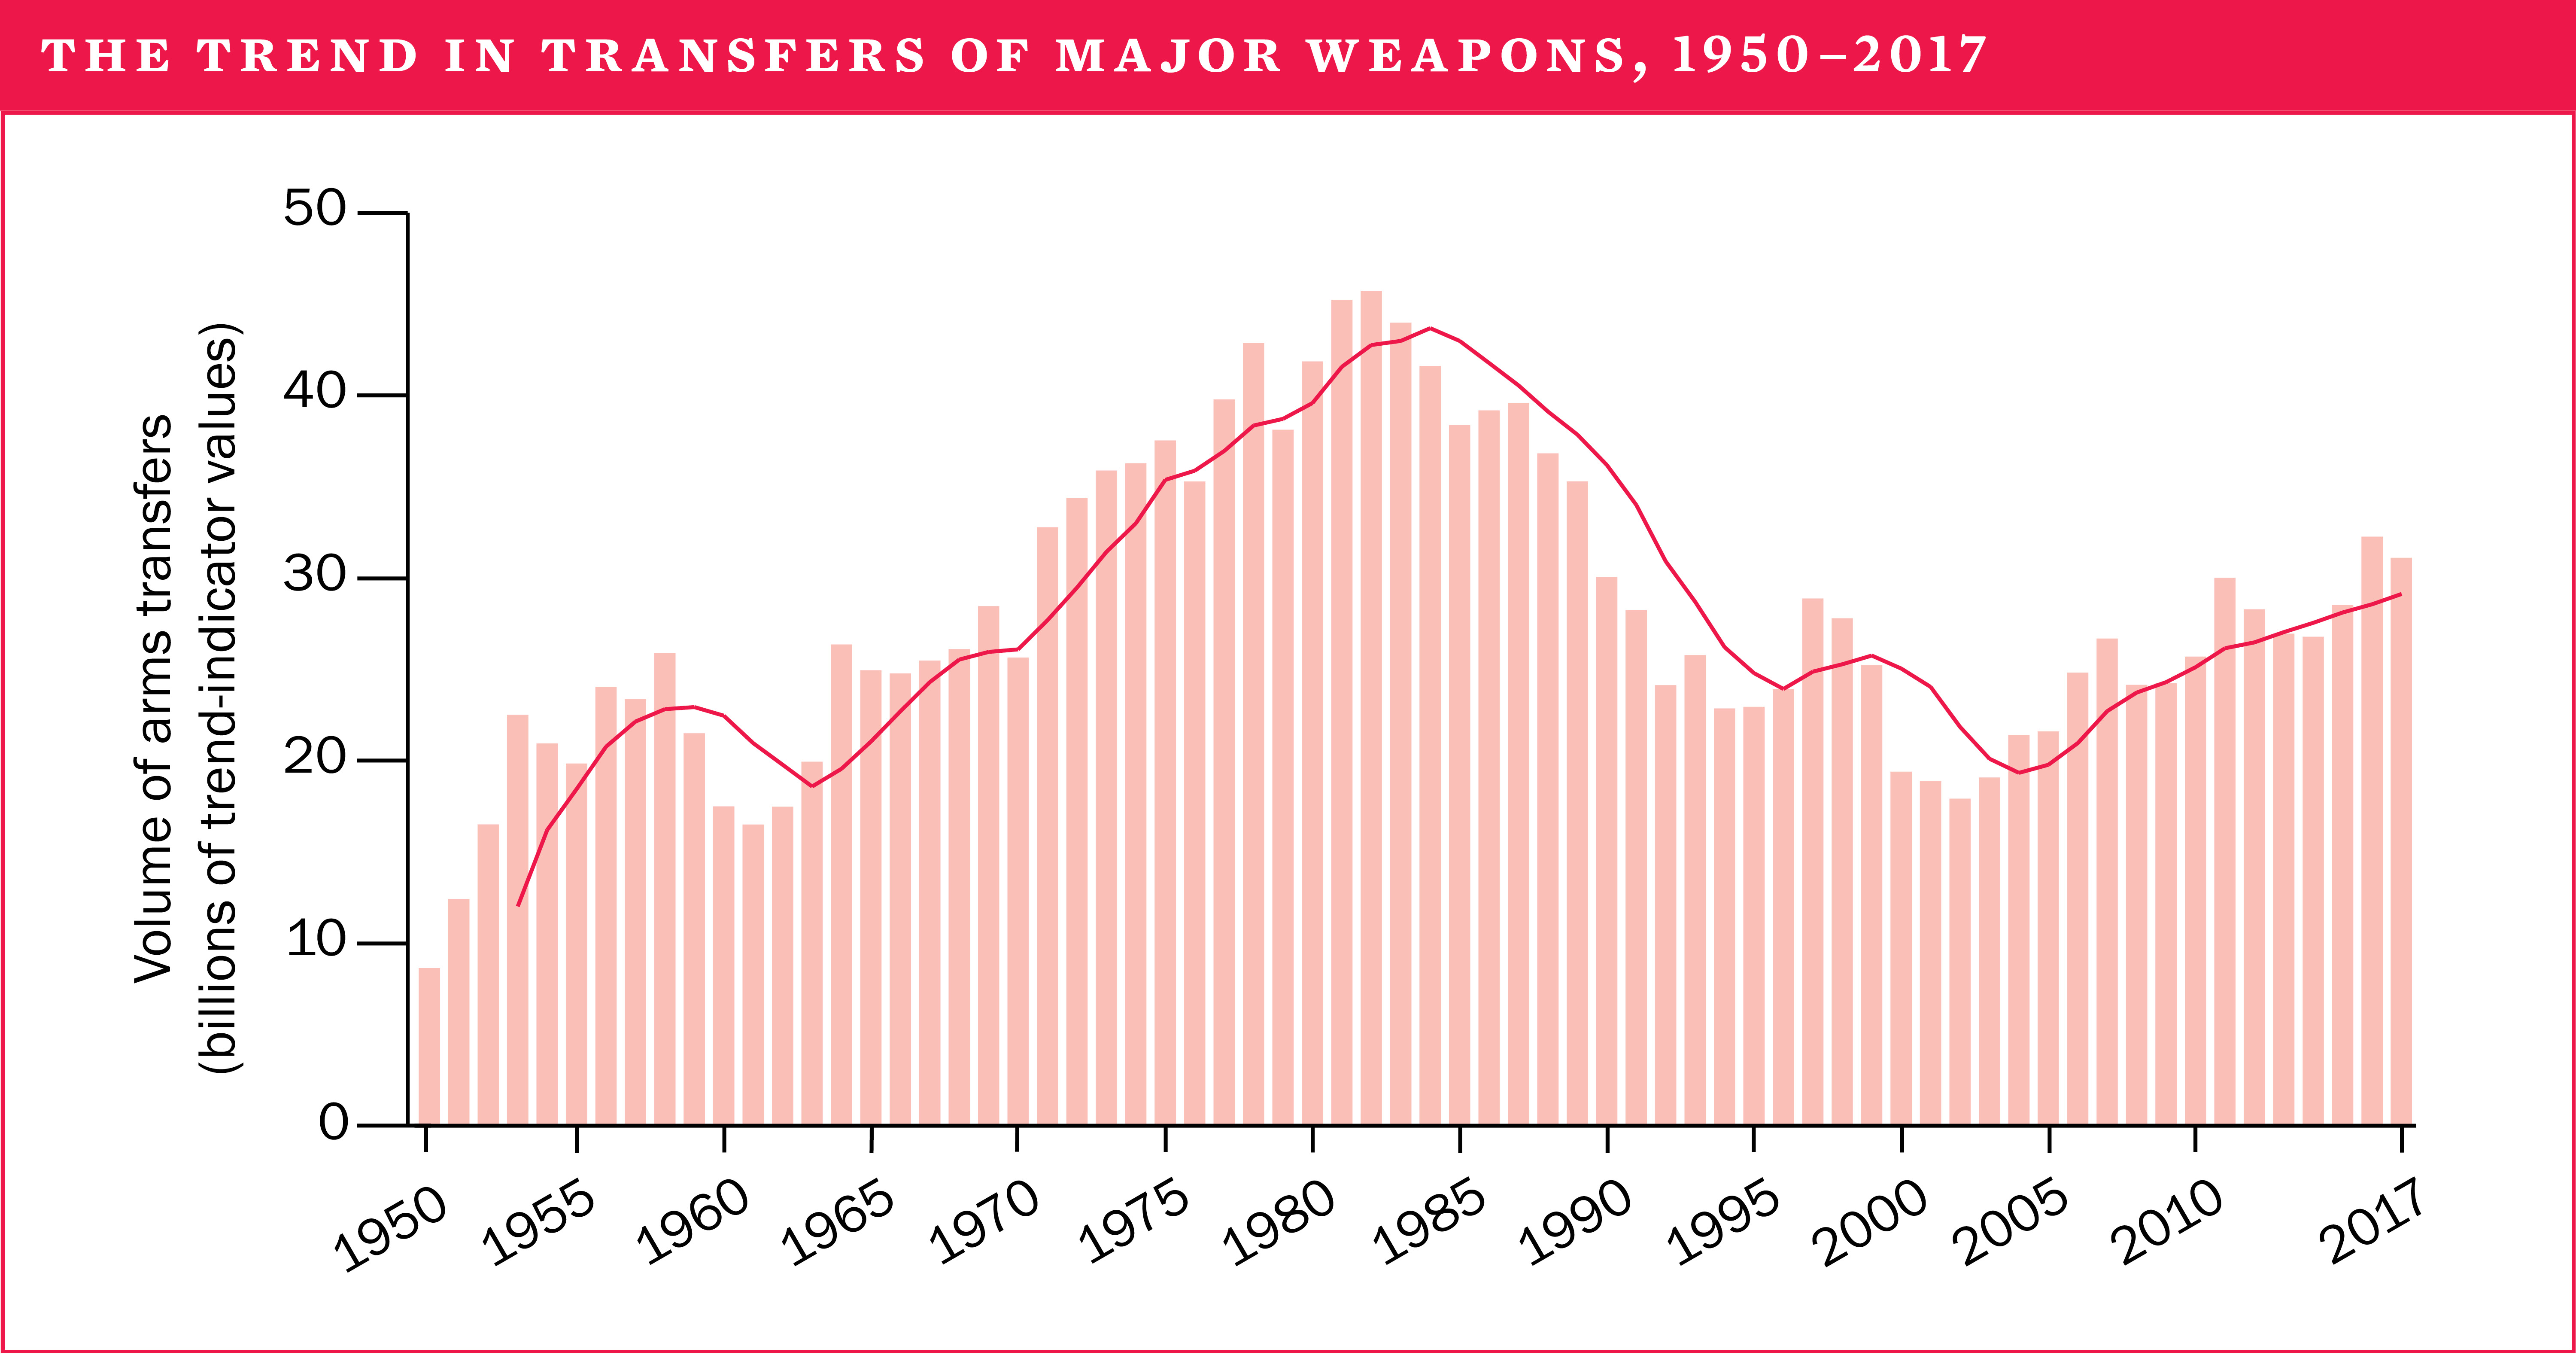
The volume of international transfers of major weapons rose by 10 per cent between 2008–12 and 2013–17, to reach its highest level since the end of the cold war. The increase marks a continuation of the steady upward trend that began in the early 2000s.
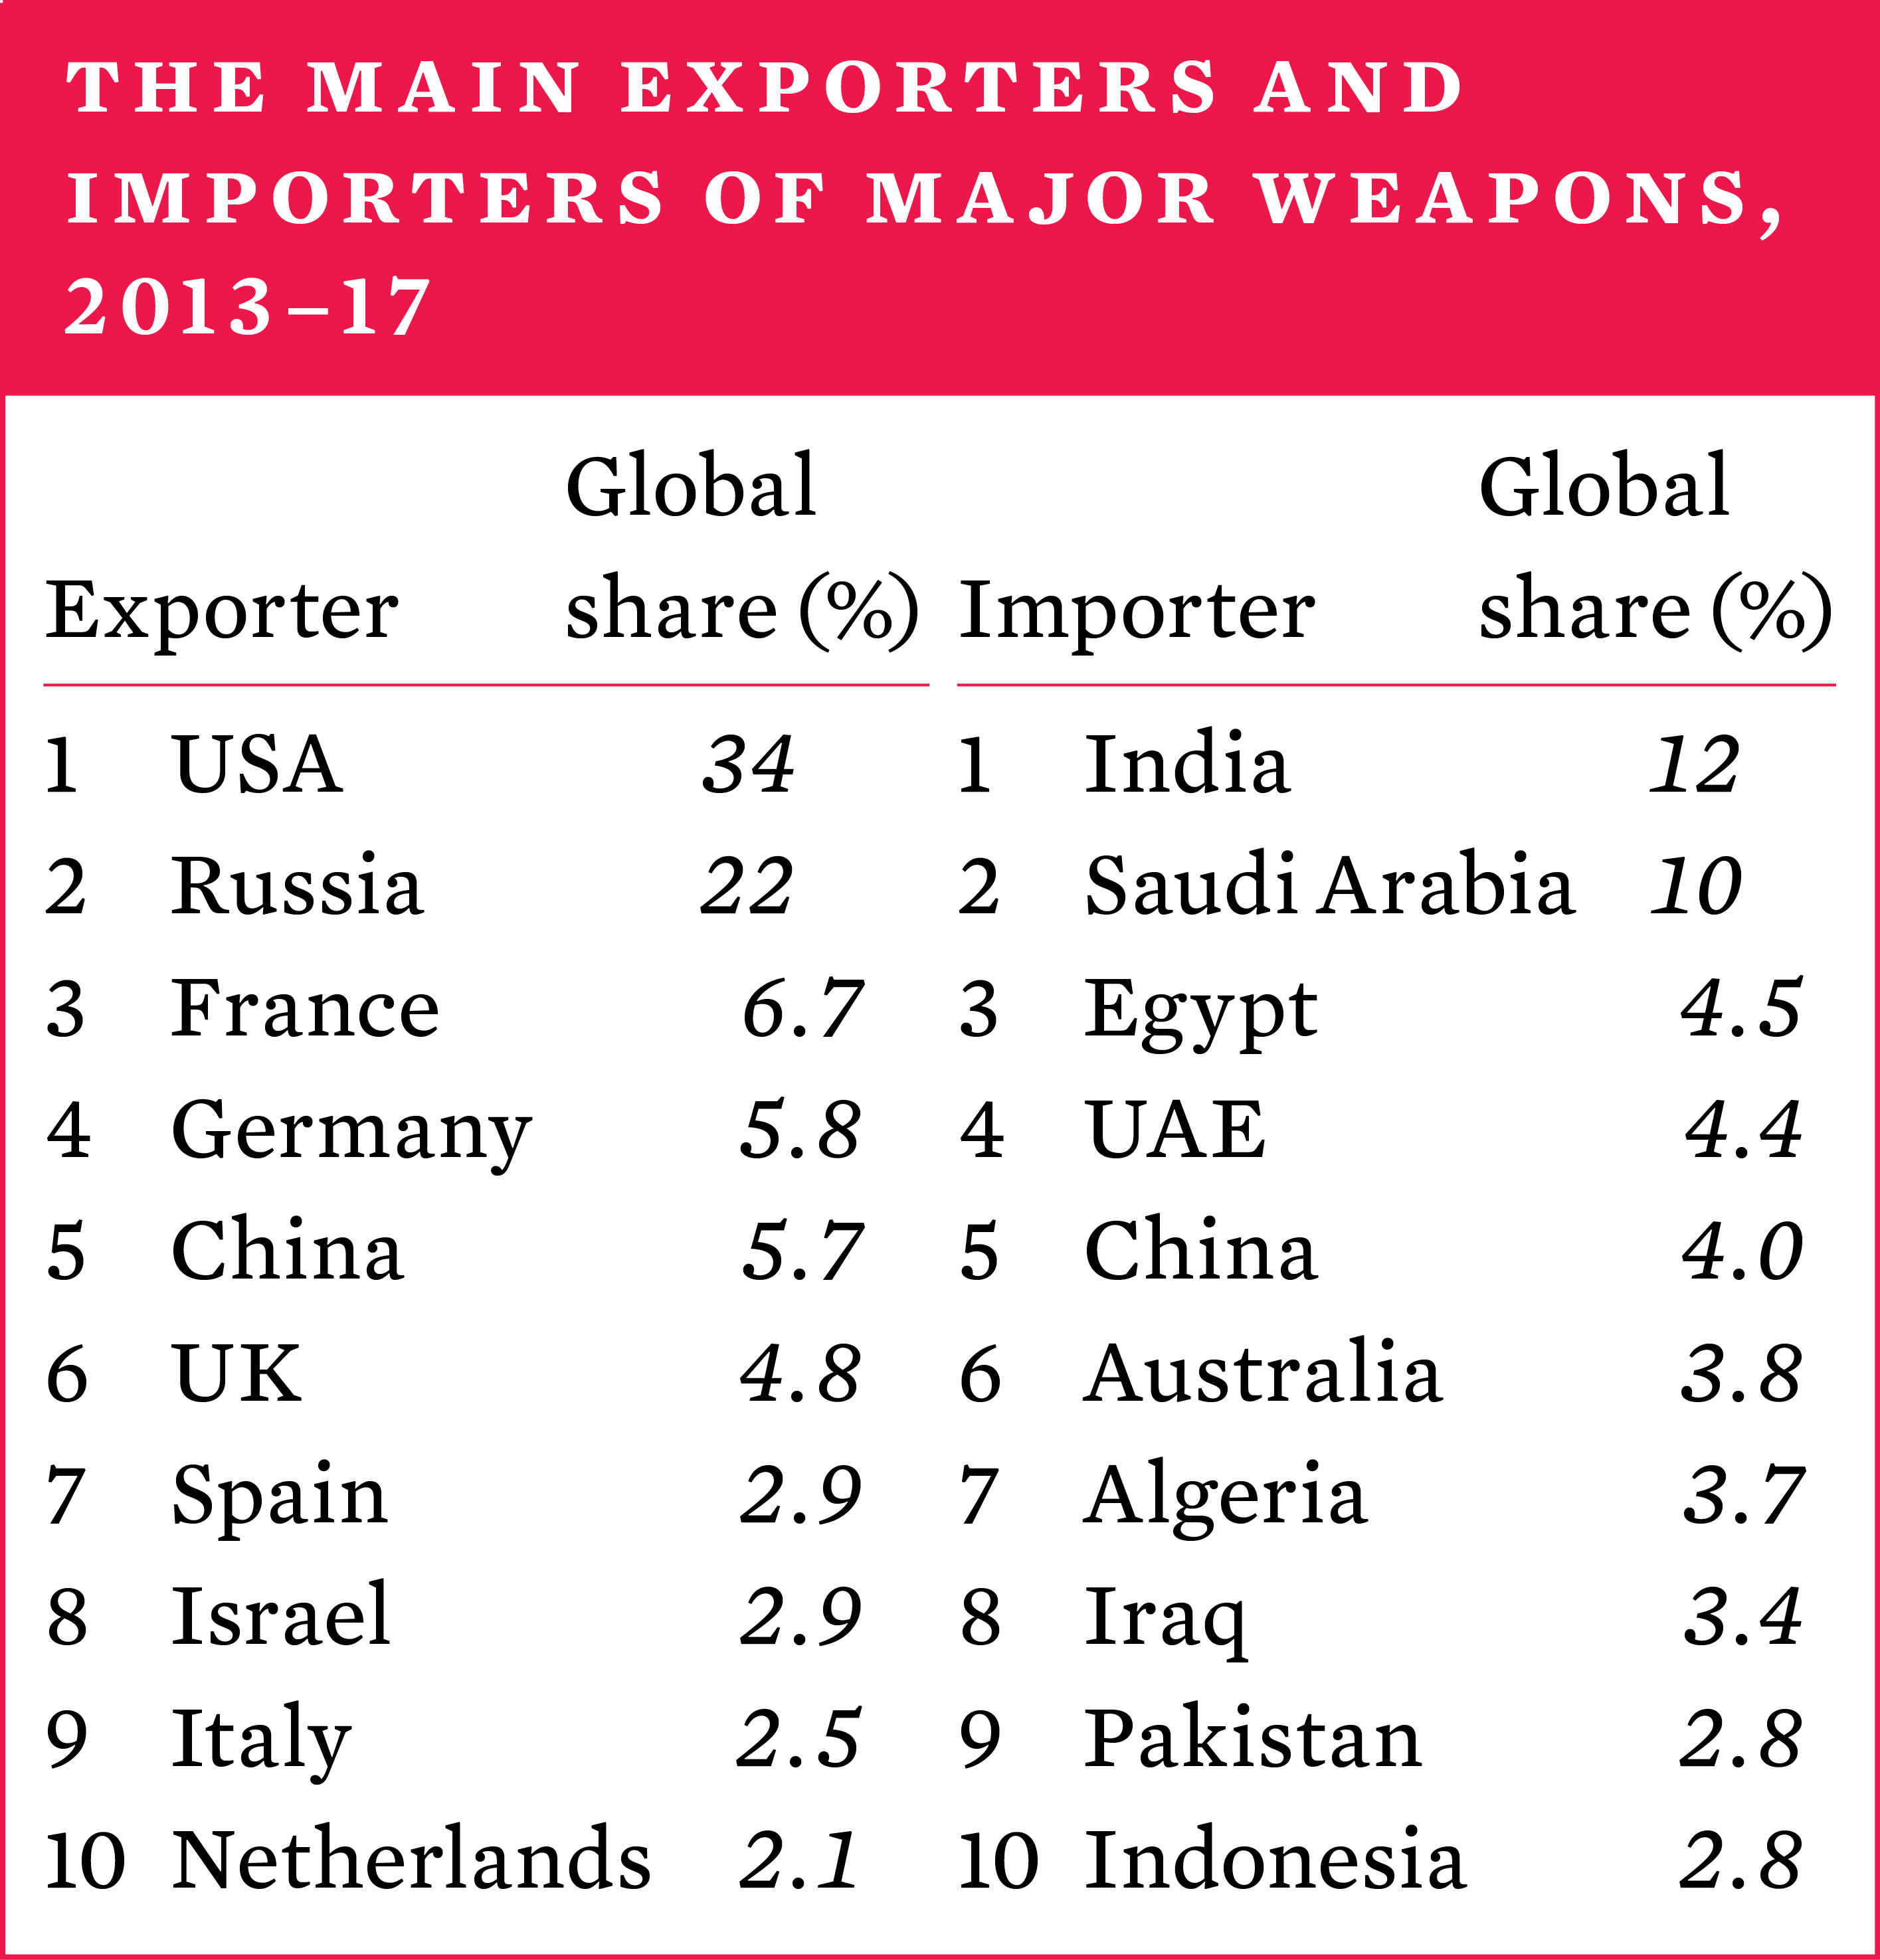
The five largest arms suppliers in 2013–17 were the United States, Russia, France, Germany and China, and they accounted for 74 per cent of the total global volume of exports of major weapons. Since 1950 the USA and Russia (or the Soviet Union before 1992) have consistently been by far the largest suppliers and, together with West European suppliers, have historically dominated the top 10 list of suppliers.
The top five arms importers were India, Saudi Arabia, Egypt, the United Arab Emirates and China, which together accounted for 35 per cent of total arms imports. Asia and Oceania was the main recipient region, accounting for 42 per cent of the total global volume of imports of major weapons in 2013–17, followed by the Middle East, which accounted for 32 per cent. The flow of arms to the Middle East grew by 103 per cent between 2008–12 and 2013–17. The flow of arms to Asia and Oceania also rose, by 1.8 per cent. By contrast, the flow of arms to Europe decreased notably, by 22 per cent, as did those to the Americas, by 29 per cent, and Africa, by 22 per cent.
Transparency in arms transfers
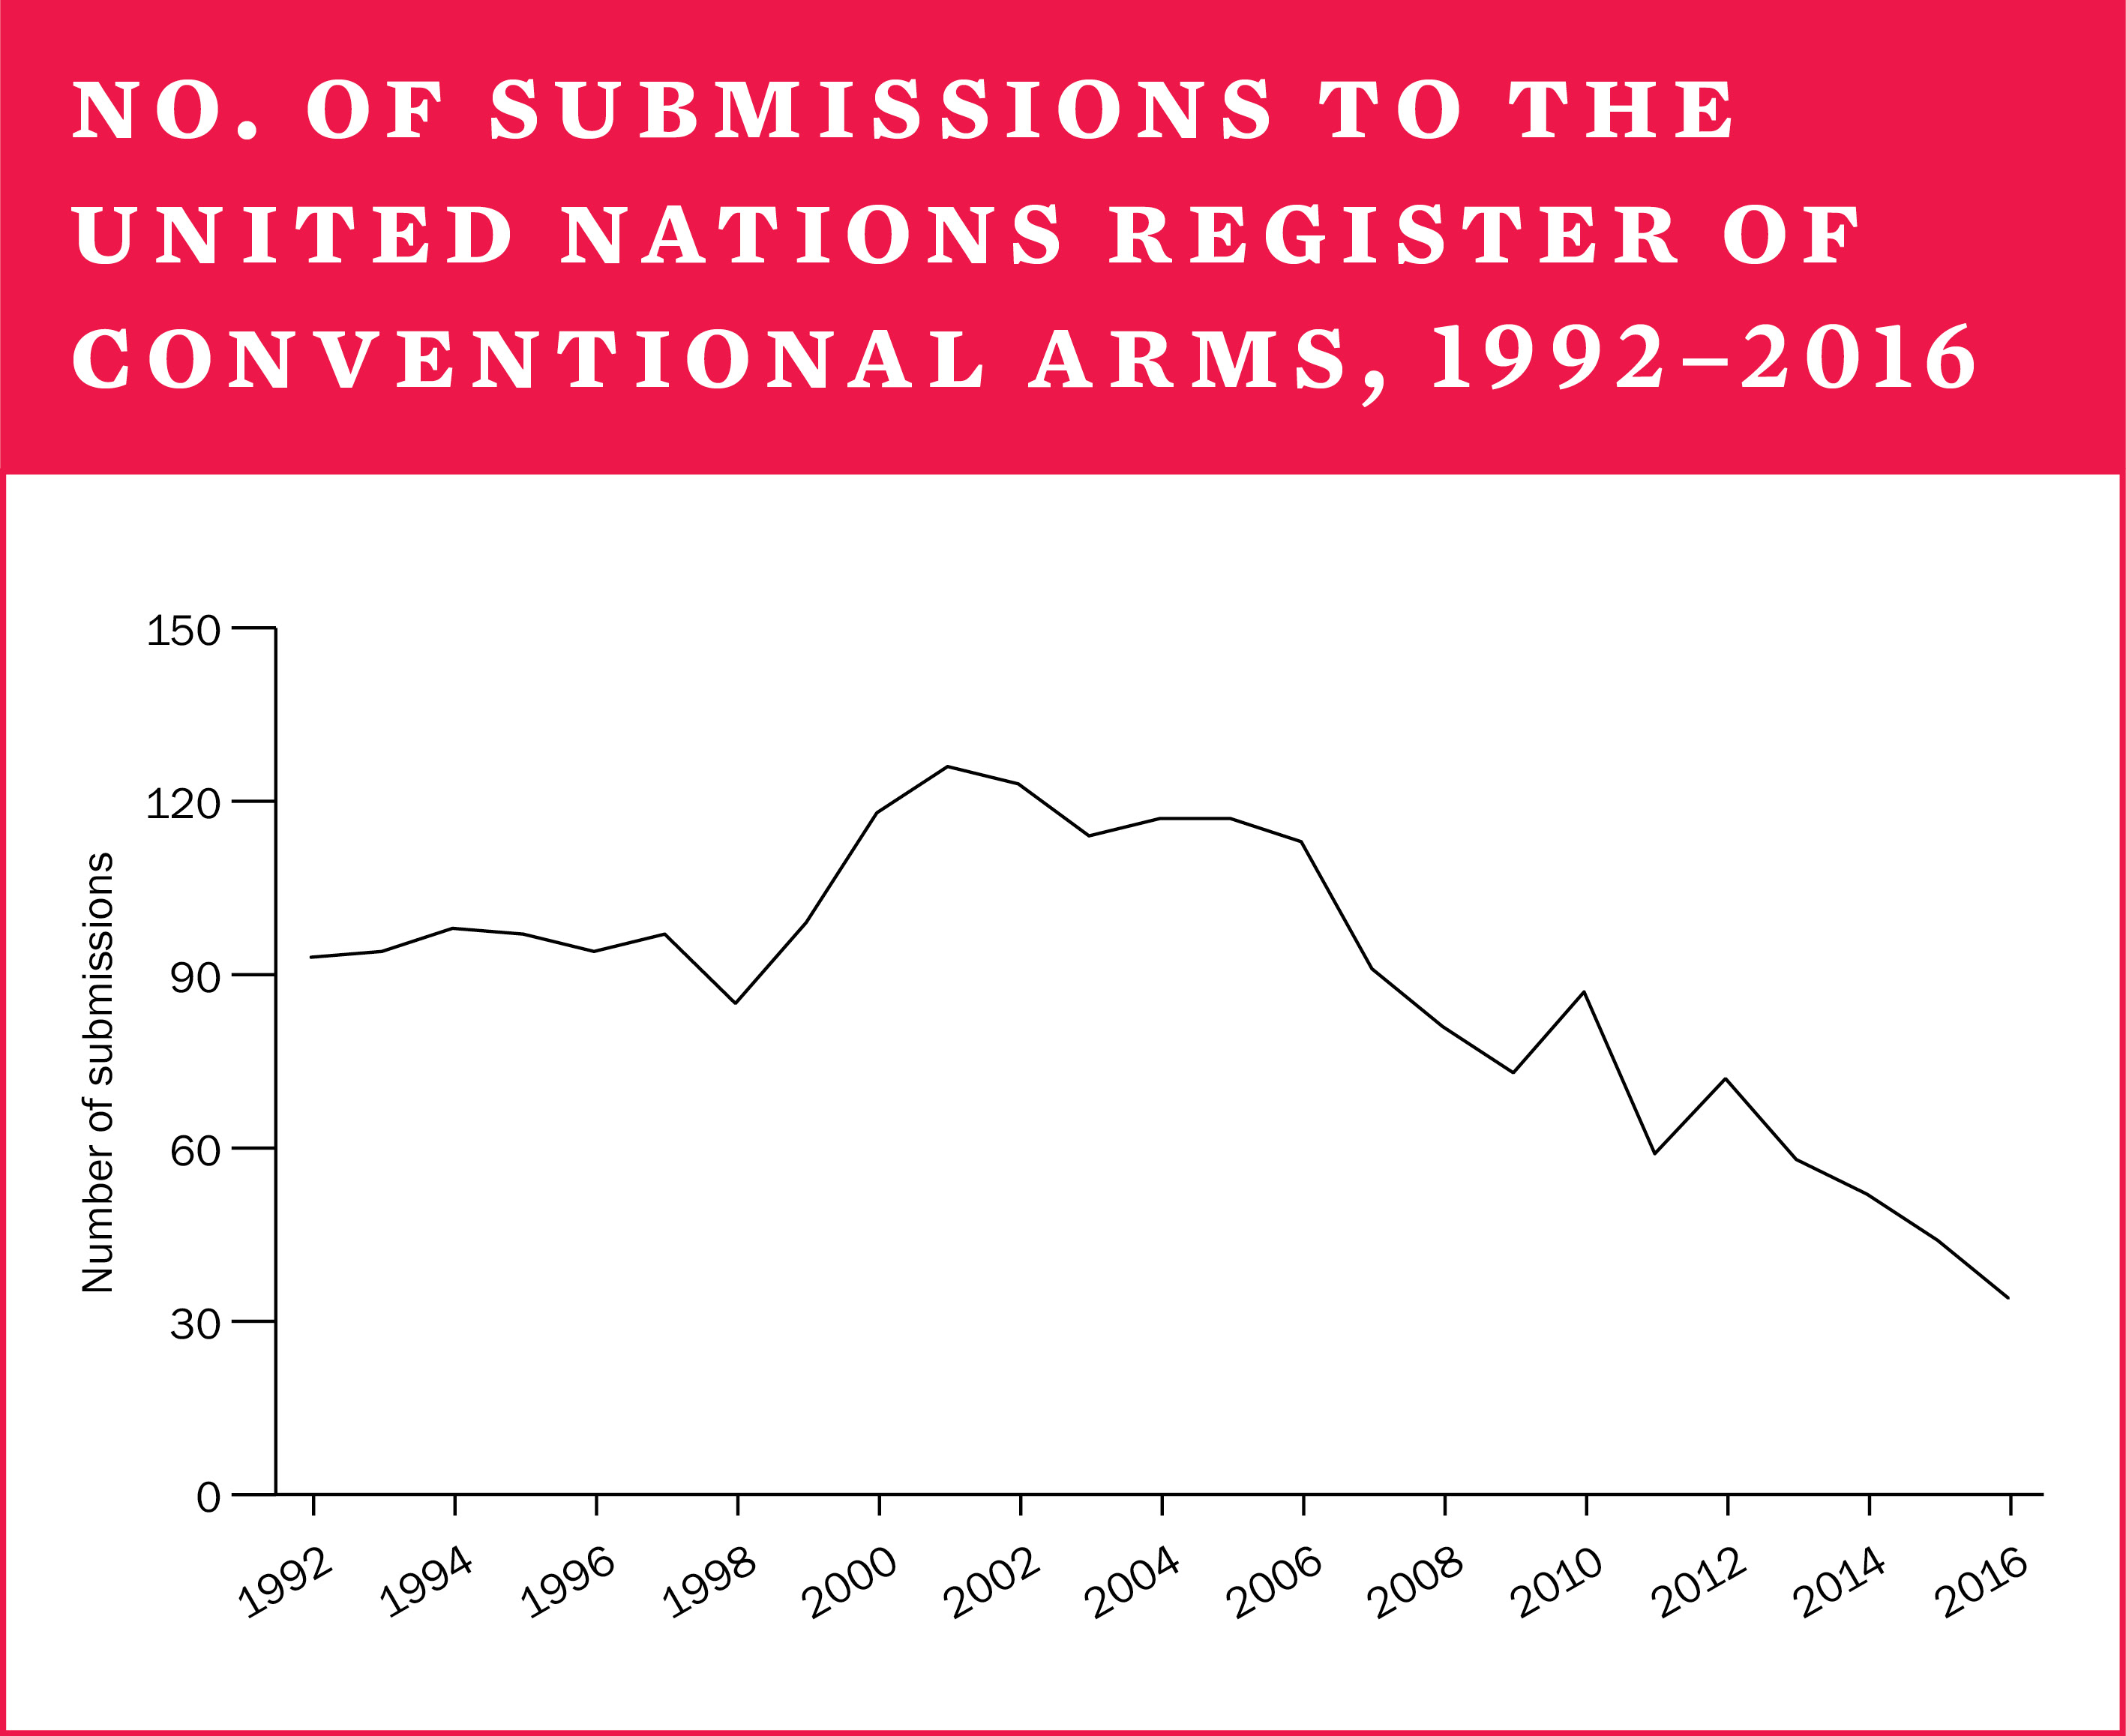
As has been the case for the past few years, there were few positive developments in official public transparency in arms transfers in 2017. The number of states reporting their arms exports and imports to the United Nations Register of Conventional Arms (UNROCA) dropped to an all-time low and no major changes occurred with respect to the various national and regional reporting mechanisms. However, most of the growing number of states that have ratified the 2013 Arms Trade Treaty have fulfilled their obligation of reporting arms exports and imports.
The financial value of states’ arms exports, 2016*
While SIPRI data on arms transfers does not represent their financial value, many arms-exporting countries publish figures on the financial value of their arms exports. Based on such data, SIPRI estimates the total value of the global arms trade in 2016 to have been at least $88.4 billion.
Arms production and military services
The SIPRI Top 100 arms-producing and military services companies ranks the largest companies in the arms industry (outside China) by their sales, both domestic and for export. The total sales of the SIPRI Top 100 for 2016* totalled almost $375 billion, a 1.9 per cent increase compared with 2015. This was the first year of increase since the peak of 2010. The rise is mainly attributable to the overall increase in the arms sales of US-based companies, which dominate the Top 100. Taken together, the arms sales of West European arms producers were stable in 2016. The combined arms sales of Russian companies continued to grow in 2016, while there were mixed trends in arms sales for the arms producers in countries with emerging arms industries and other countries with established arms industries. Major drivers for the growth in arms sales of the Top 100 include international tensions and armed conflict on the demand side and the implementation of military industrialization strategies at the national level on the supply side. Other key causes of changes can be company mergers, acquisitions and divestments.
*The latest year for which data is available.
English