The independent resource on global security
5. International arms transfers and developments in arms production
Contents
Overview, Siemon T. Wezeman and Aude Fleurant [PDF]
I. Global trends in arms transfers, 2018, Siemon T. Wezeman, Aude Fleurant, Alexandra Kuimova, Nan Tian and Pieter D. Wezeman [PDF]
II. Supplier developments, 2018, Siemon T. Wezeman, Aude Fleurant, Alexandra Kuimova, Nan Tian and Pieter D. Wezeman [PDF]
III. Recipient developments, 2018, Siemon T. Wezeman, Aude Fleurant, Alexandra Kuimova, Nan Tian and Pieter D. Wezeman [PDF]
IV. Transparency in arms transfers, Mark Bromley and Siemon T. Wezeman [PDF]
V. The financial value of states’ arms exports, Mark Bromley, Quitterie de Labbey and Pieter D. Wezeman [PDF]
VI. Arms production and military services, Aude Fleurant and Nan Tian [PDF]
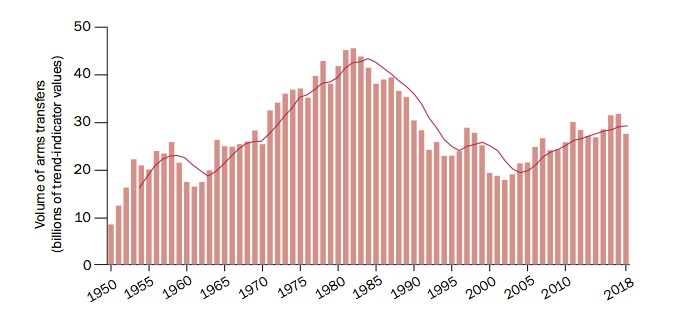
The volume of international transfers of major arms grew by 7.8 per cent between 2009–13 and 2014–18, reaching its highest level since the end of the cold war. This growth is a continuation of the steady upward trend that began in the early 2000s.
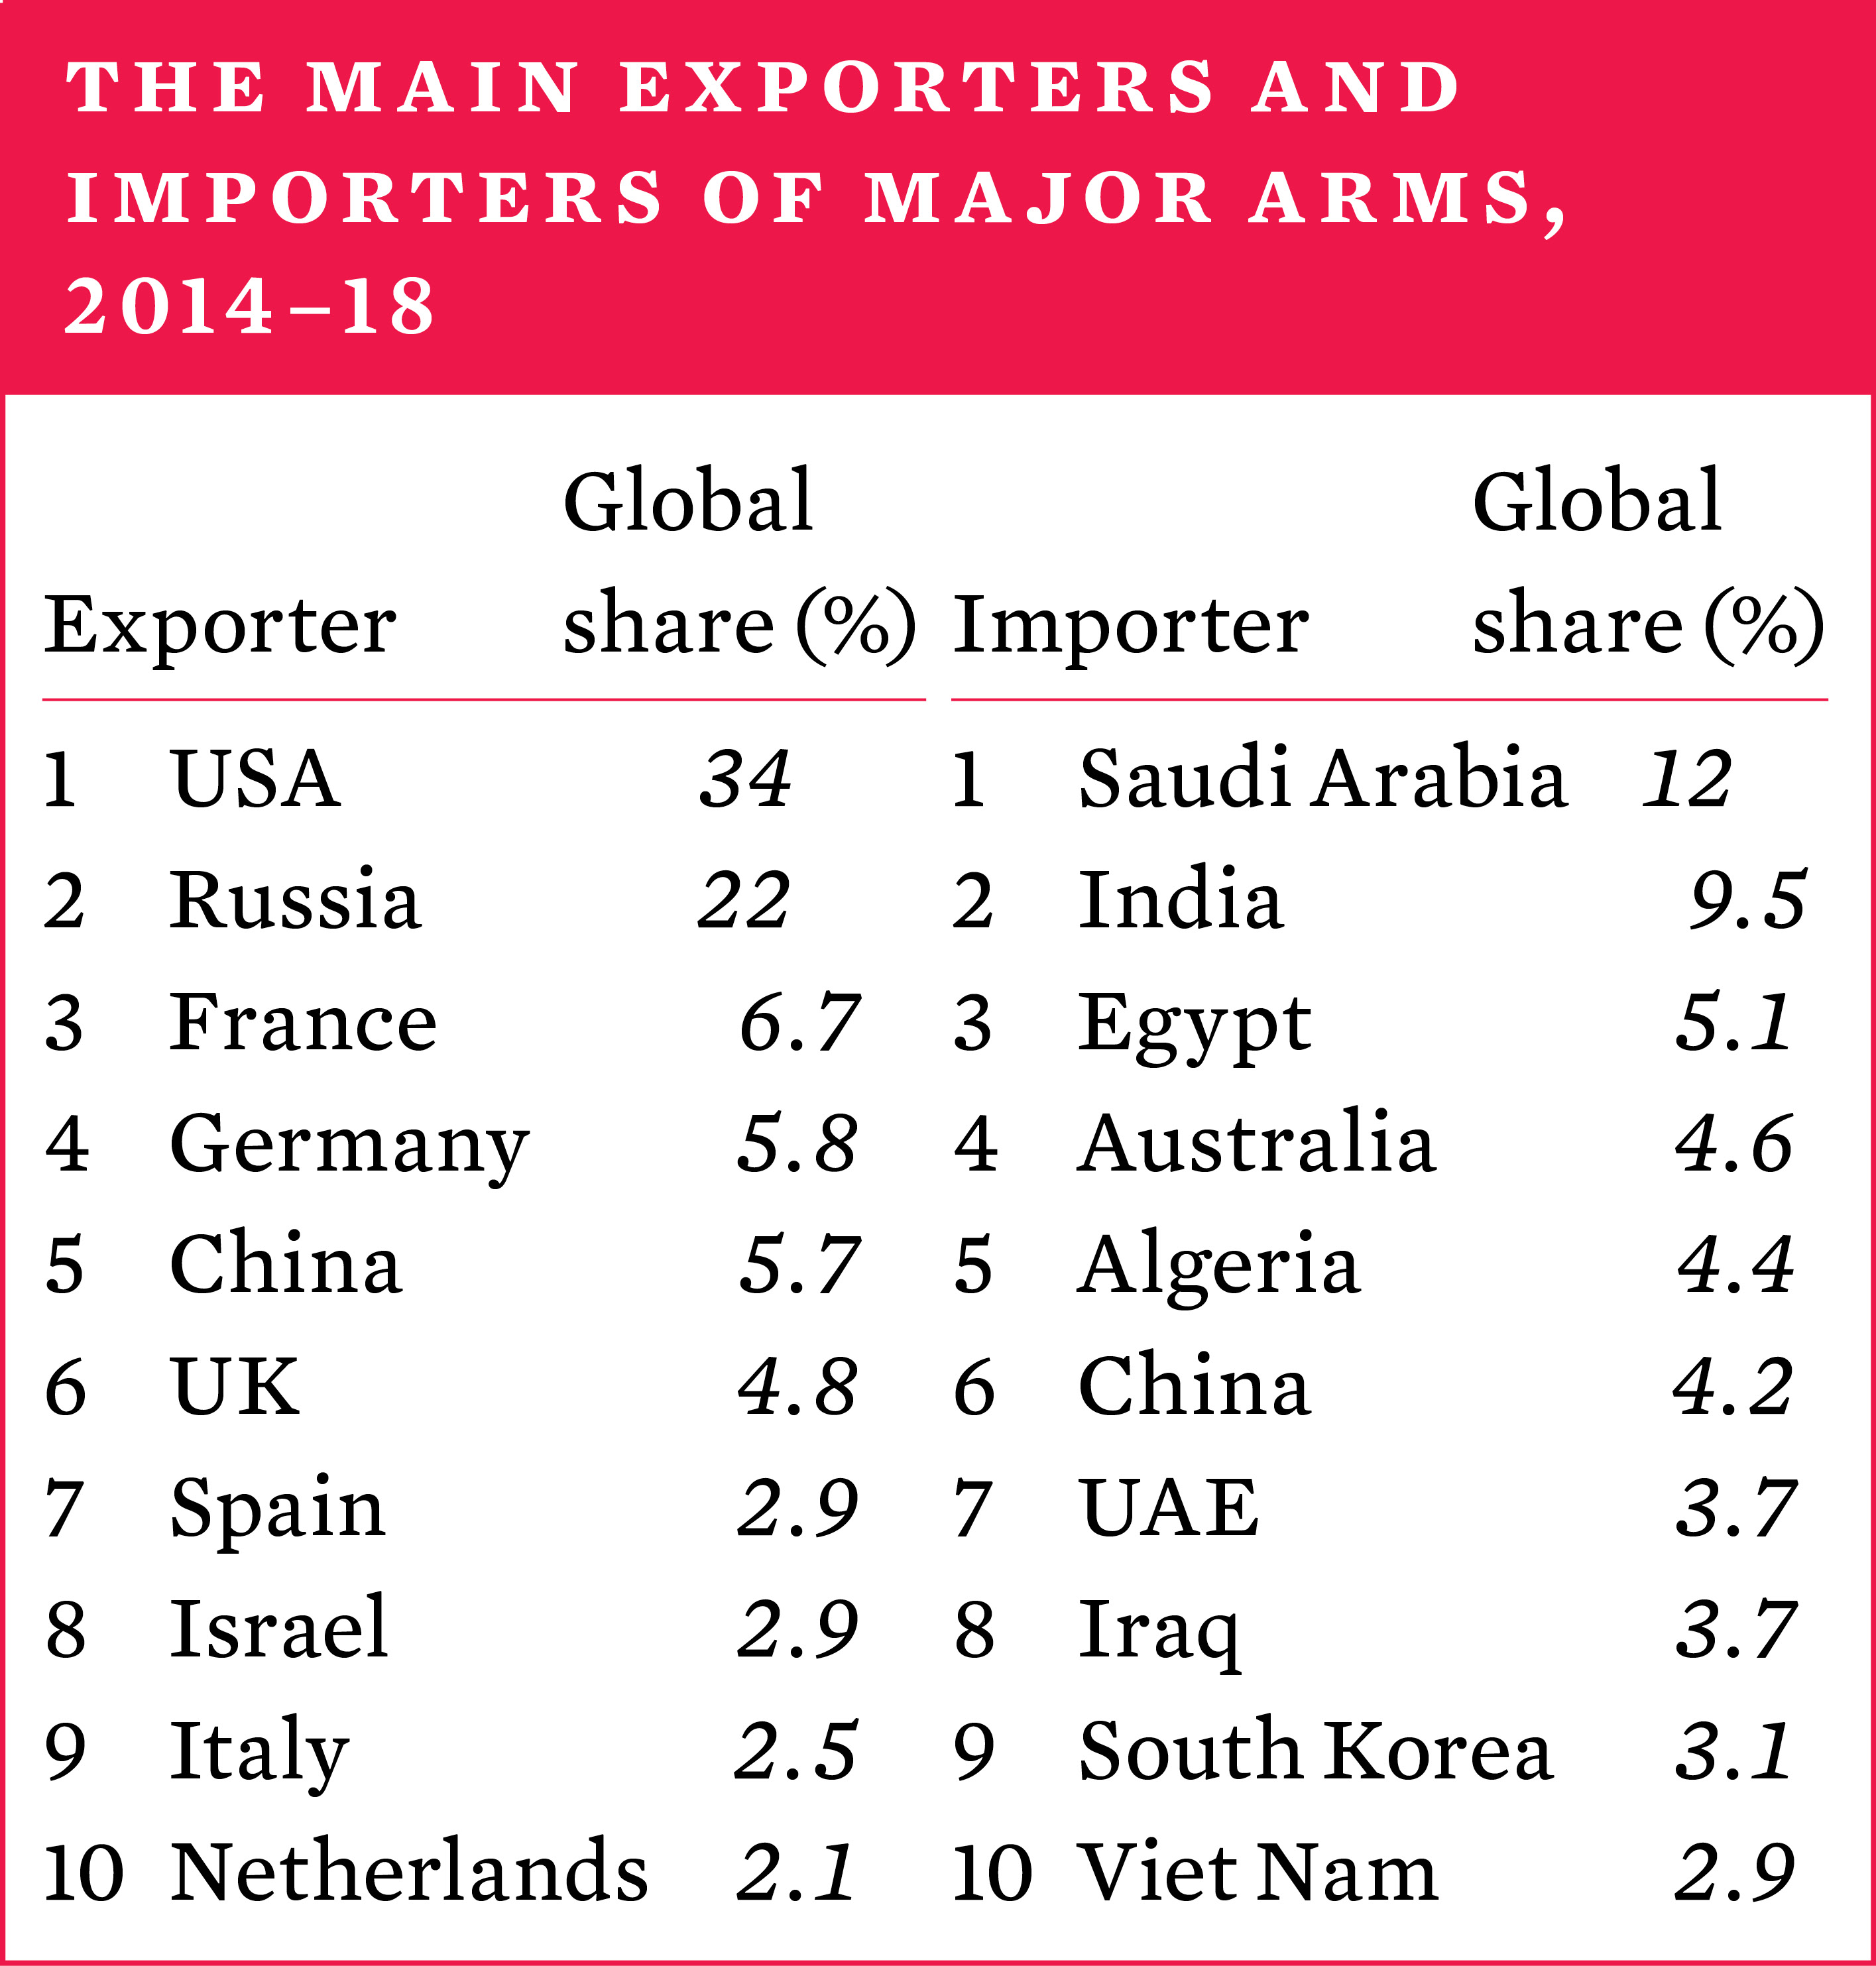
The five largest suppliers in 2014–18 were the United States, Russia, France, Germany and China, and they accounted for 75 per cent of the total global volume of exports. Since 1950, the USA and Russia (or the Soviet Union before 1992) have consistently been by far the largest suppliers and, together with West European exporters, have historically dominated the top 10 list of suppliers.
The USA was the largest exporter of major arms in the five-year period 2014–18, with deliveries to at least 98 states. The gap between the USA and all other exporters widened. In 2009–13, US arms exports were 12 per cent higher than those of Russia—the second-largest arms exporter in that period. In 2014–18, US arms exports were 75 per cent higher than Russia’s.
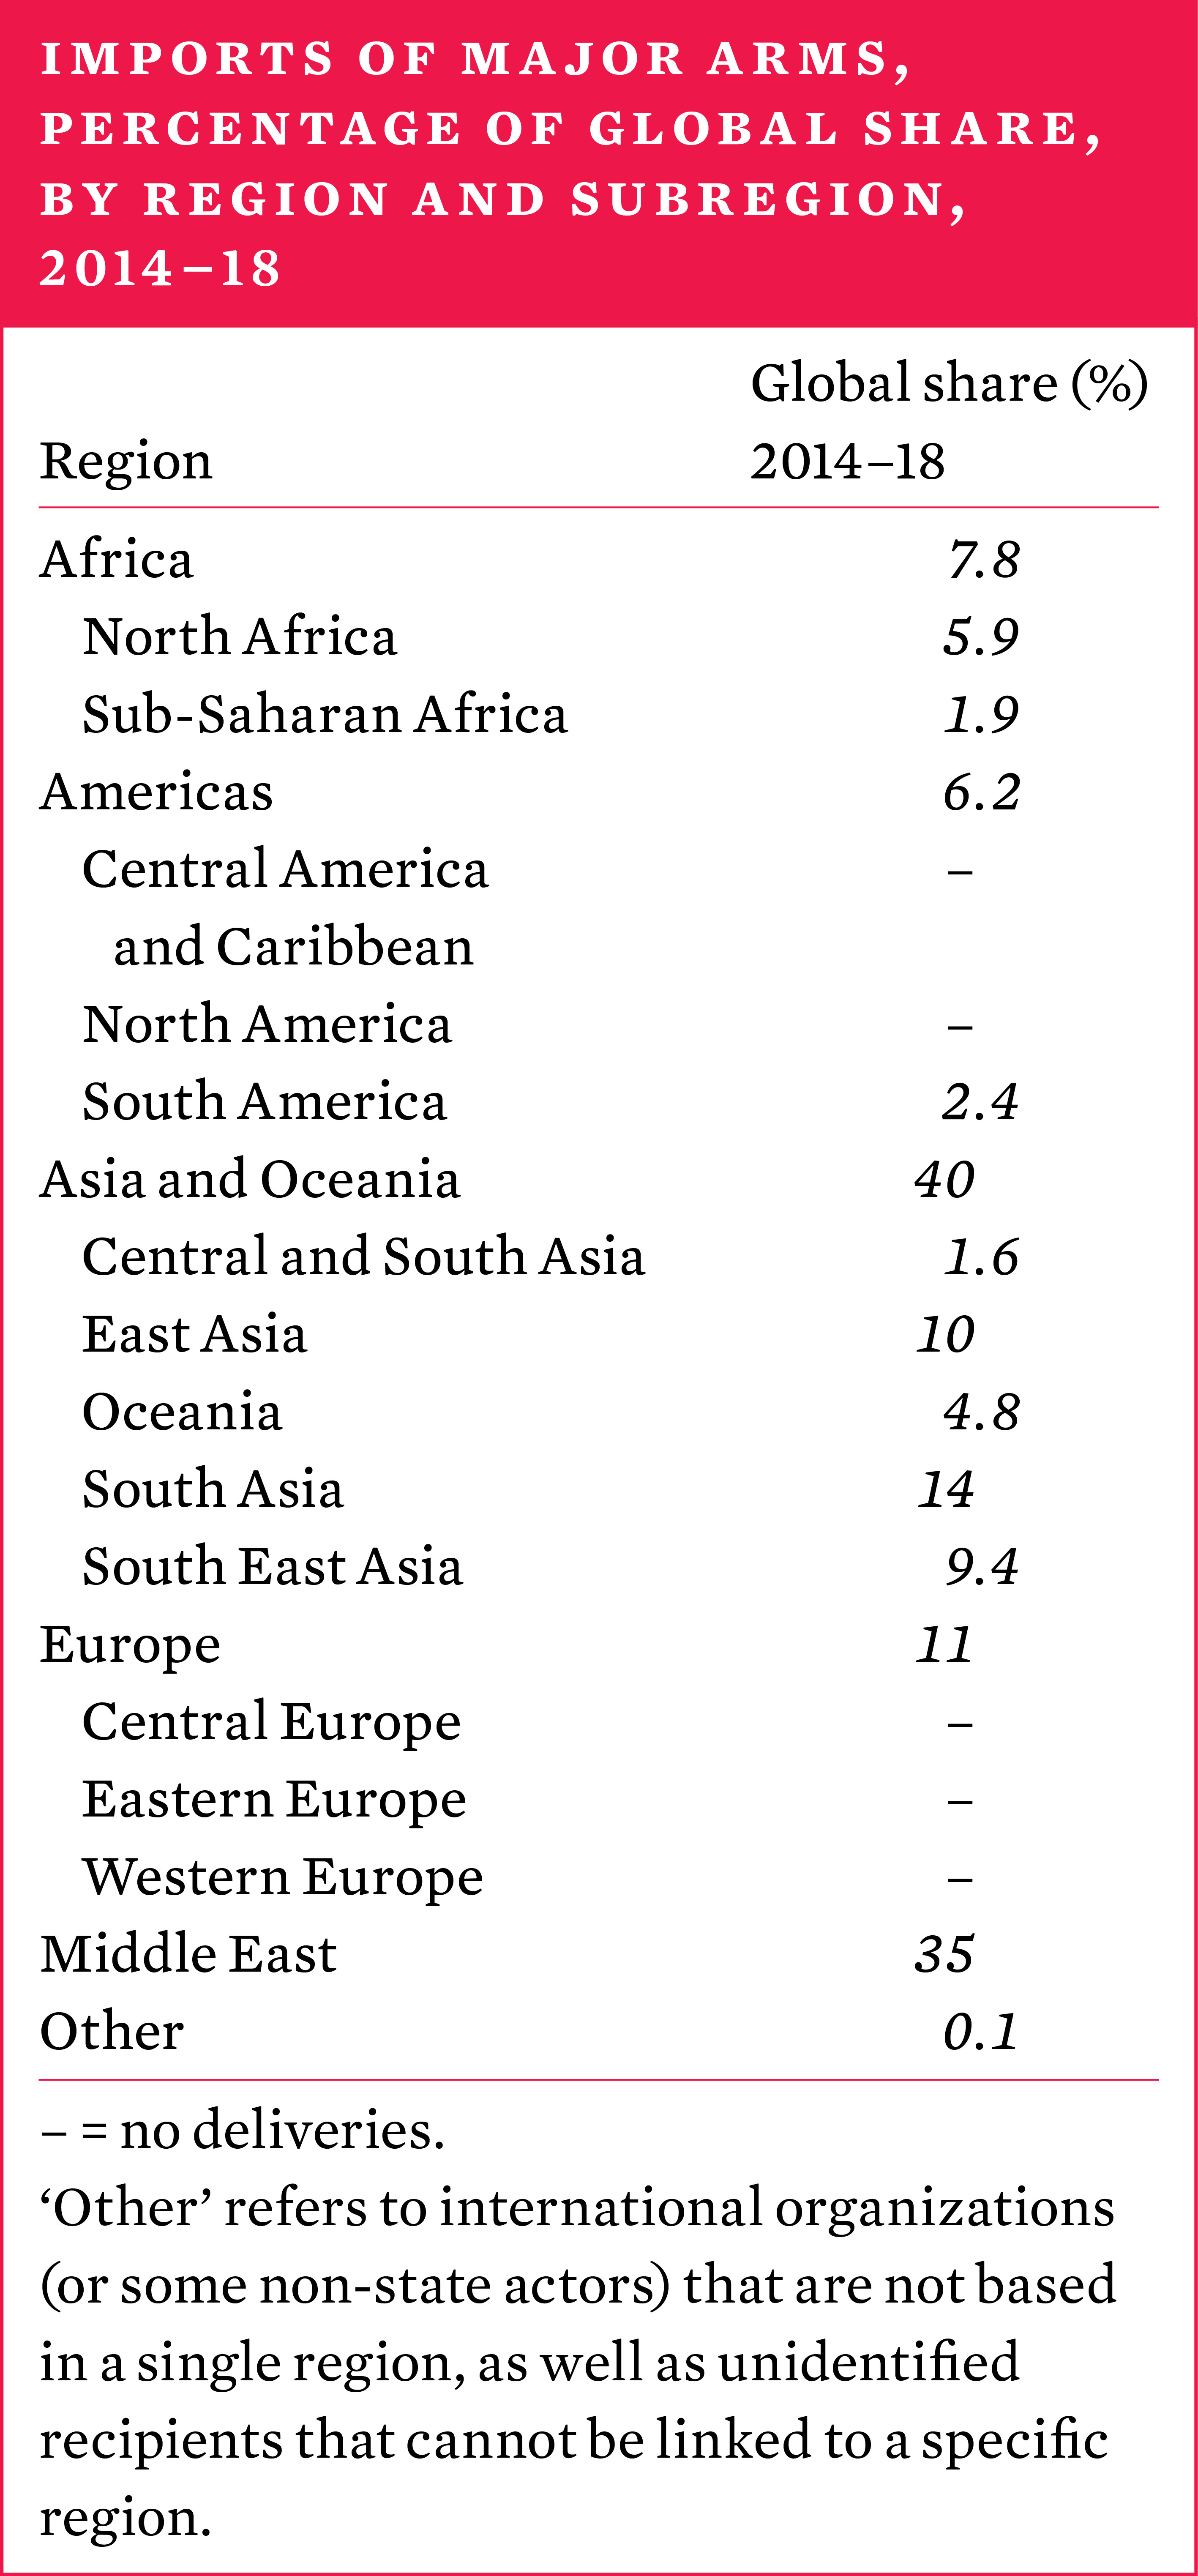
Asia and Oceania was the main recipient region, accounting for 40 per cent of the global volume of imports of major arms in 2014–18. The Middle East accounted for 35 per cent of imports. The flow of arms to the Middle East grew by 87 per cent between 2009–13 and 2014–18. In contrast, the flow of arms to all other regions decreased between the two periods: to the Americas by 36 per cent, to Europe by 13 per cent, to Asia and Oceania by 6.7 per cent and to Africa by 6.5 per cent. The five largest arms importers were Saudi Arabia, India, Egypt, Australia and Algeria, which together accounted for 35 per cent of total arms imports.
The group of largest importers is more diverse and has seen more changes over time than the group of largest exporters. Since 1950, SIPRI has identified 255 actors (202 states, 48 non-state armed groups and 5 inter-national organizations) that received major arms in at least one year. Of these, 26 received arms in all the years between 1950 and 2018, and another 3 in all the years they existed.
Transparency in arms transfers
The number of states reporting their arms exports and imports to the United Nations Register of Conventional Arms (UNROCA) remained at a very low level and no major changes occurred in the various national and regional reporting mechanisms. As more states ratified the 2013 Arms Trade Treaty (ATT), the number of states fulfilling their treaty obligation to report arms exports and imports has grown. However, the proportion of ATT states parties submitting a report decreased in 2018.
The financial value of states’ arms exports, 2017*
While SIPRI data on arms transfers does not represent their financial value, many arms-exporting states do publish figures on the financial value of their arms exports. Based on such data, SIPRI estimates that the total value of the global arms trade in 2017 was at least $95 billion.
* The latest year for which data is available.
Arms production and military services
The SIPRI Top 100 arms-producing and military services companies ranks the largest companies in the arms industry (outside China) by their sales, both domestic and for export. The total value of the sales of the SIPRI Top 100 in 2017* was $398 billion, a 2.5 per cent increase compared with 2016. This growth was driven by increases in arms procurement spending by several states, in particular the USA and Russia as well as various countries participating in armed conflicts, notably in the Middle East.
English