The independent resource on global security
Appendix 5A. Military expenditure data, 2000–2009
Contents
I. Introduction
II. Regional trends and major spenders
III. Tables of military expenditure
Box 5A.1. World trends in military expenditure
Box 5A.2. Trends in military spending in Africa
Box 5A.3. Trends in military spending in the Americas
Box 5A.4. Trends in military spending in Asia and Oceania
Box 5A.5. Trends in military spending in Europe
Box 5A.6. Trends in military spending in the Middle East
Table 5A.1. The 15 countries with the highest military expenditure in 2009
Table 5A.2. Military expenditure by region, by international organization and by income group, 2000–2009
Table 5A.3. Military expenditure by country, in local currency, 2000–2009
Table 5A.4. Military expenditure by country, in constant US dollars for 2000–2009 and current US dollars for 2009
Table 5A.5. Military expenditure by country as percentage of gross domestic product, 2000–2008
Appendix 5A contains tables of military expenditure by region, country and income group, in local currency and constant dollars, and as a share of GDP for the period 2000–2009. Read the full appendix [PDF].
Summary
Military expenditure, 2000–2009
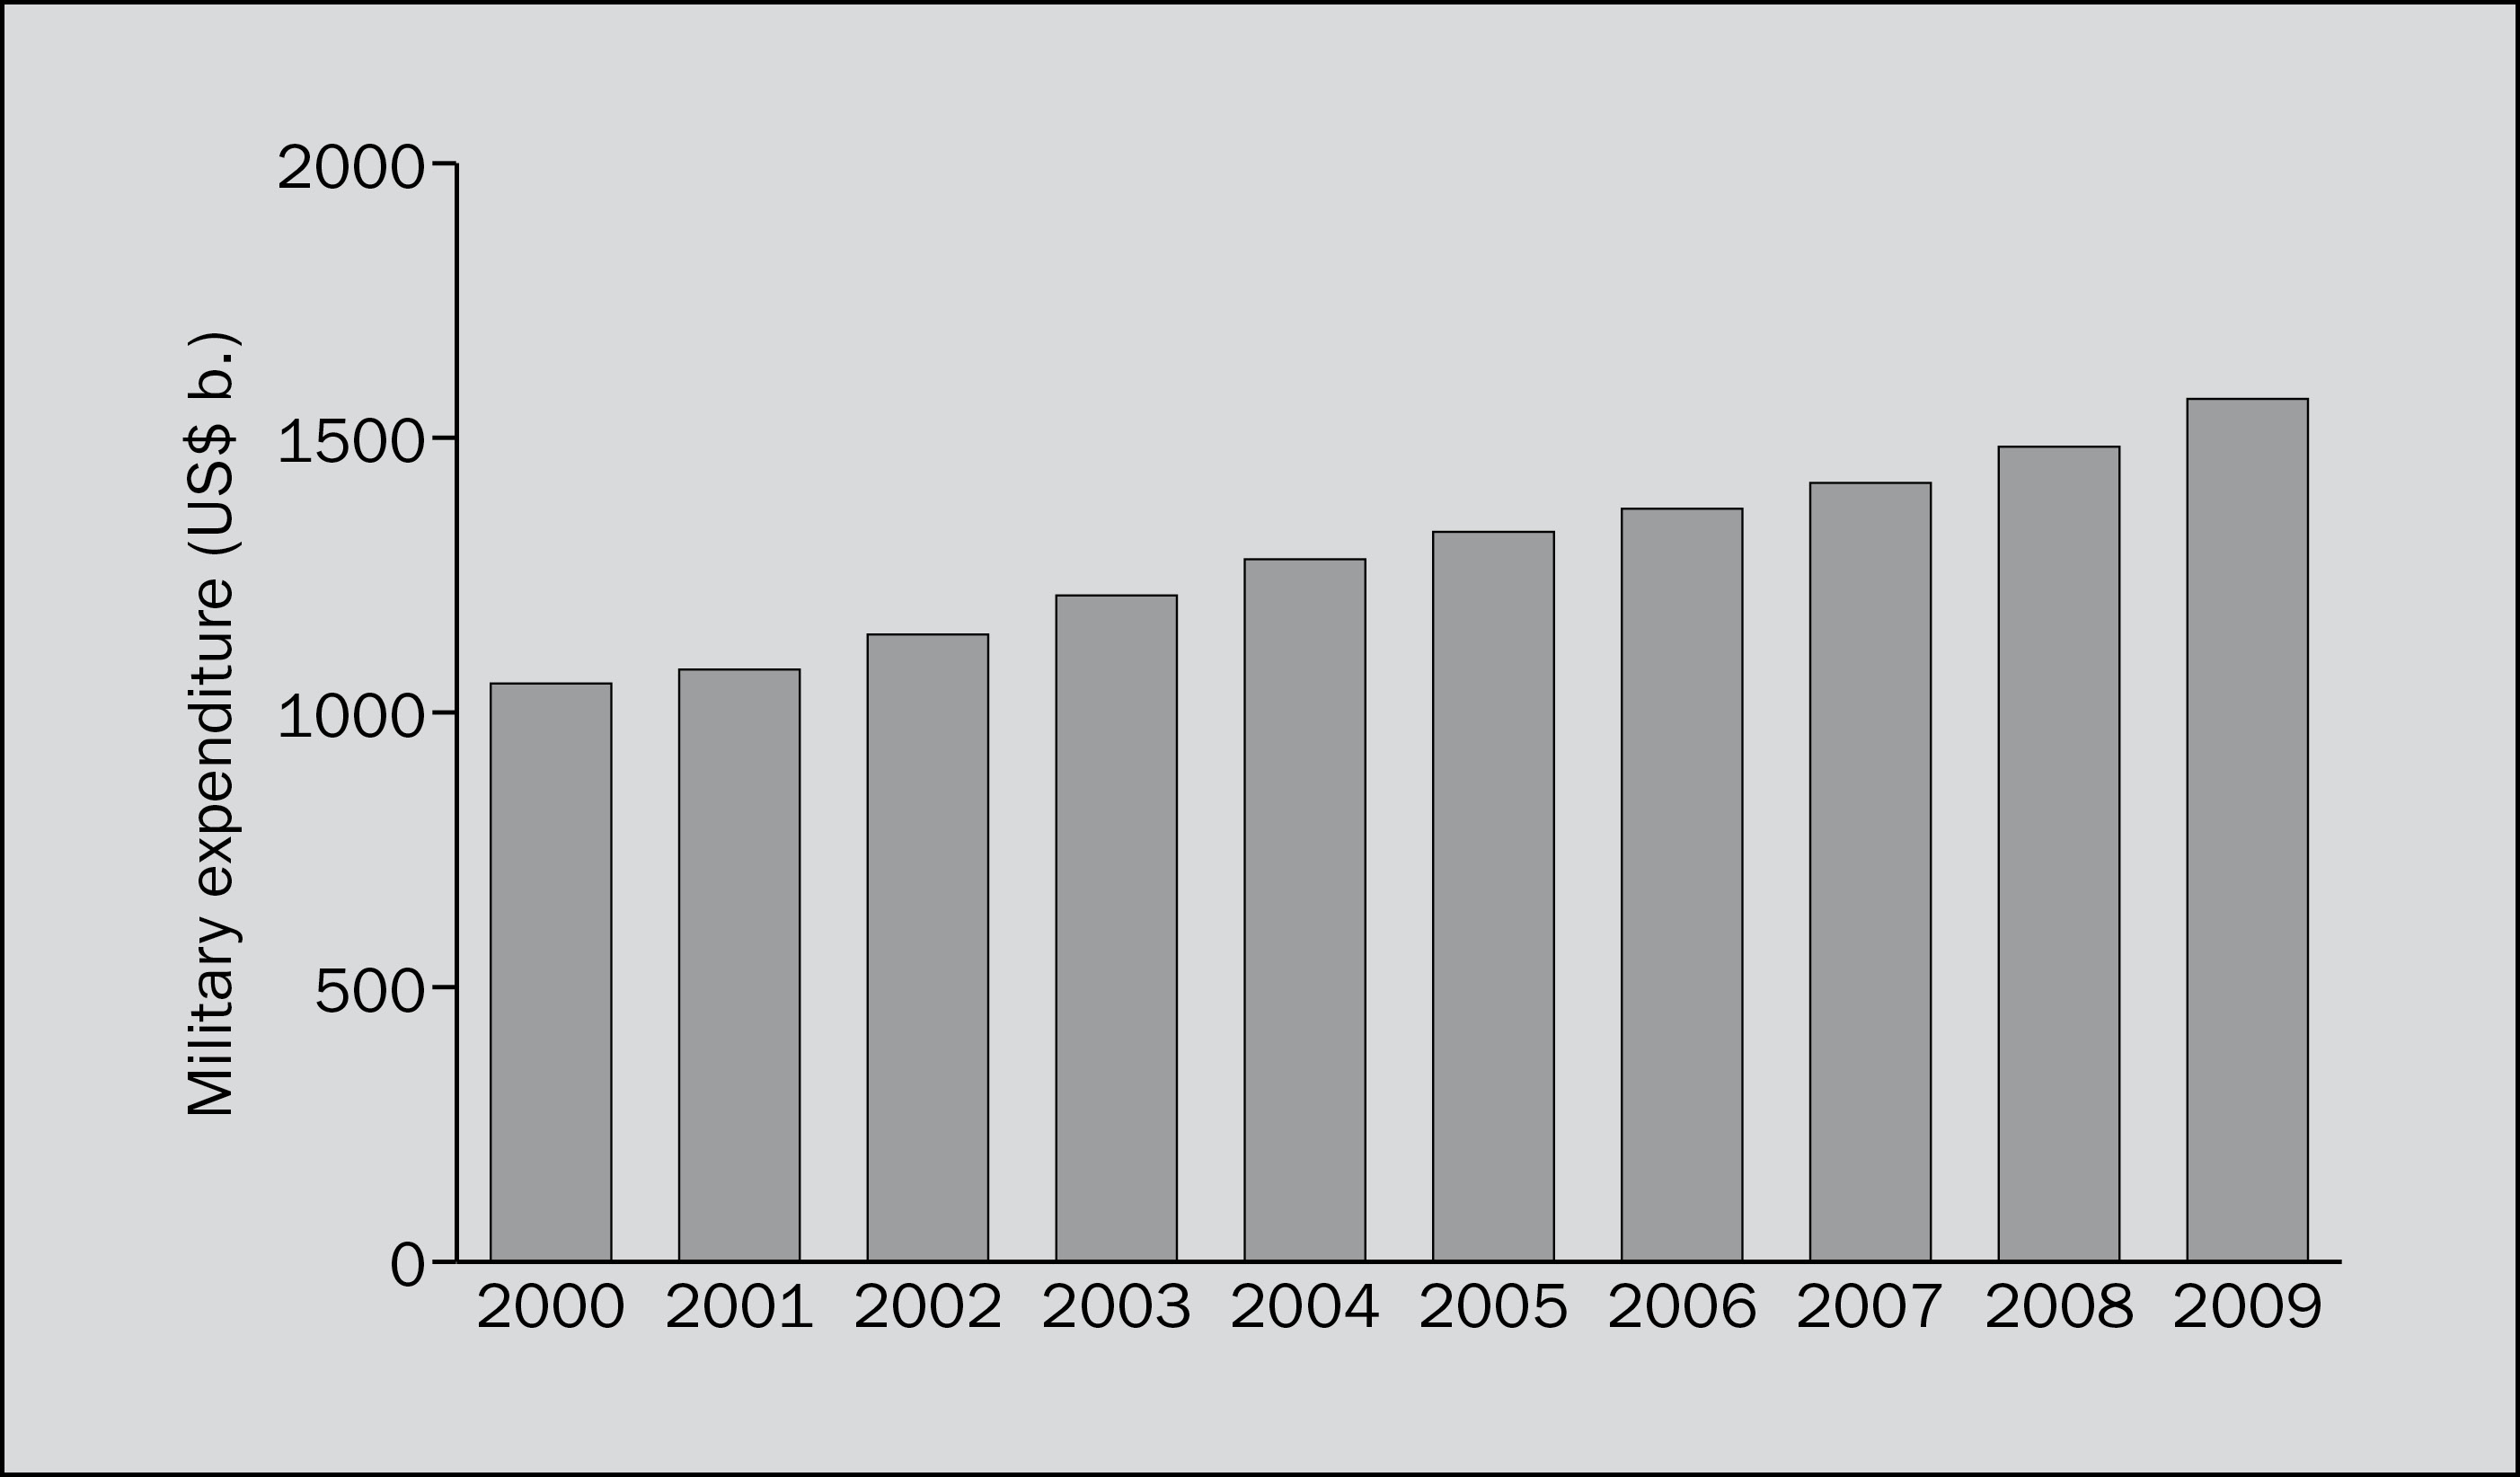
To allow comparison over time, the figures in the bar chart are in US dollars at constant (2008) prices.
Military expenditure, by region, 2009
| Region | Spending ($ b.) |
|---|---|
| Africa | 27.4 |
| North Africa | 10.0 |
| Sub-Saharan Africa | 17.4 |
| Americas | 738 |
| Central America and the Caribbean |
5.6 |
| North America | 680 |
| South America | 51.8 |
| Asia and Oceania | 276 |
| Central Asia | . . |
| East Asia | 210 |
| Oceania | 20.4 |
| South Asia | 44.0 |
| Europe | 386 |
| Eastern | 60.0 |
| Western and Central | 326 |
| Middle East | 103 |
| World total | 1531 |
The spending figures are in current (2009) US dollars.
The 10 largest military spenders in 2009 accounted for 75 per cent of world military spending, with the USA alone accounting for 43 per cent. While the identities of the top spenders have not changed in recent years, their relative rankings have, with European countries falling down the ranking.
The top 10 military spenders, 2009
| Rank | Country | Spending ($ b.) |
World share (%) |
|---|---|---|---|
| 1 | USA | 661 | 43 |
| 2 | China | [100] | [6.8] |
| 3 | France | 63.9 | 4.2 |
| 4 | UK | 58.3 | 3.8 |
| 5 | Russia | [53.3] | [3.5] |
| 6 | Japan | 51.0 | 3.3 |
| 7 | Germany | 45.6 | 3.0 |
| 8 | Saudi Arabia | 41.3 | 2.7 |
| 9 | India | 36.3 | 2.4 |
| 10 | Italy | 35.8 | 2.3 |
| World total | 1531 |
[ ] = SIPRI estimate. The spending figures are in current (2009) US dollars.
SIPRI military expenditure figures are based on information available in open sources, primarily supplied by governments. They represent a low estimate; the true level of military spending is certainly higher, due to omitted countries and items of spending. Nonetheless, SIPRI estimates capture the great majority of global military spending and accurately represent overall trends.
This data is obtained from the SIPRI Military Expenditure Database.
English