The independent resource on global security
10. International arms transfer and developments in arms production
Contents
Overview, Siemon T. Wezeman and Aude Fleurant [PDF]
I. Developments in arms transfers, 2016, Siemon T. Wezeman, Aude Fleurant, Nan Tian and Pieter D. Wezeman [PDF]
II. Arms transfers as military aid, Siemon T. Wezeman [PDF]
III. Transparency in arms transfers, Mark Bromley and Siemon T. Wezeman [PDF]
IV. The financial value of states' arms exports, Mark Bromley and Pieter D. Wezeman [PDF]
V. Arms production and military services, Aude Fleurant and Nan Tian [PDF]
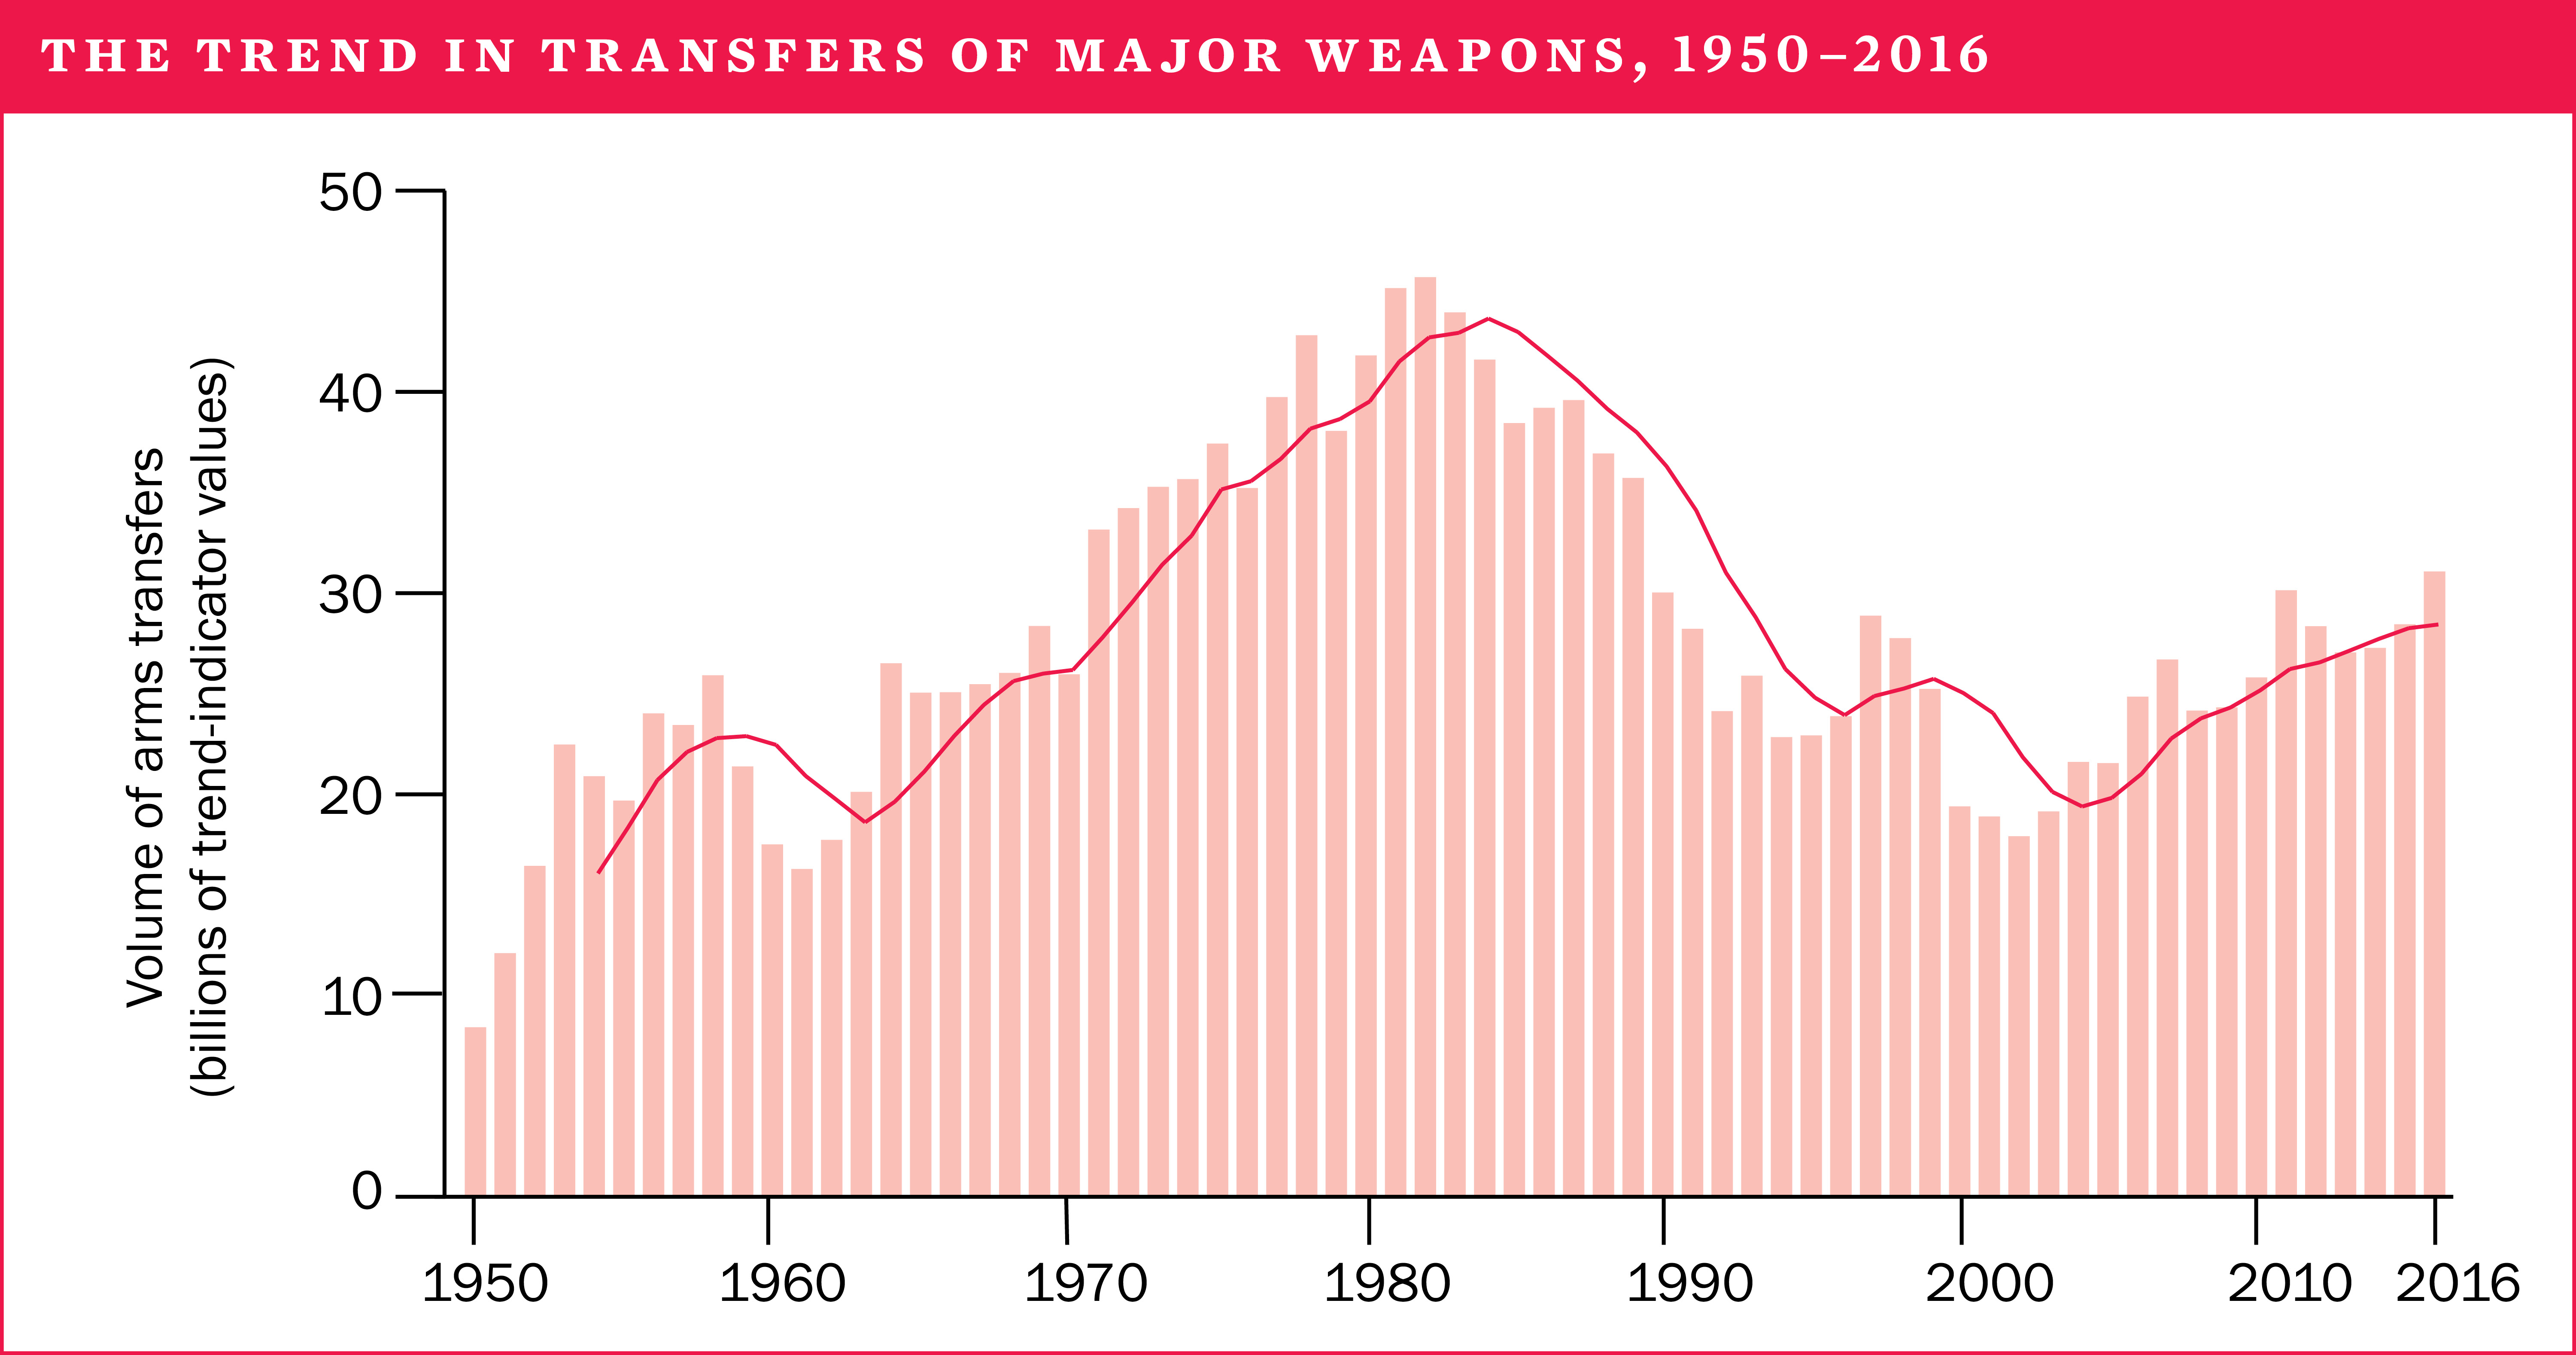
The volume of international transfers of major weapons grew by 8.4 per cent between 2007–11 and 2012–16. The five largest suppliers in 2012–16—the United States, Russia, China, France and Germany—accounted for 74 per cent of the volume of exports.
Since 1950 the USA and Russia (or the Soviet Union before 1992) have consistently been by far the largest suppliers. They, together with West European suppliers, have historically dominated the list of the 10 largest suppliers and there are no signs of any major change in the near future. In fact, this group increased its share of the global total between 2007–11 and 2012–16. This group has now been joined by China, which has firmly established itself as one of the world’s largest exporters of major weapons.
At the regional level, the flow of arms to the Middle East grew by 86 per cent between 2007–11 and 2012–16, while the flow of arms to Asia and Oceania rose by 7.7 per cent. By contrast, the flow of arms to Europe decreased notably (by 36 per cent), as did those to the Americas (by 18 per cent) and Africa (by 6.6 per cent).
Weapons delivered as military aid
Tensions and conflicts were ongoing in large parts of the world in 2016, and these often had direct links to arms acquisitions from abroad. Weapons used in these conflicts are sometimes delivered as aid. In other cases, such aid is less linked to ongoing conflicts and major tensions but rather is used as a tool to support or improve wider political relations or to gain foreign approval for policies. While the volume in arms transfers as aid has dropped, such transfers continue to be a key policy tool for some of the main suppliers.
Transparency in arms transfers
Following the trend set over the past few years, 2016 was once again disappointing in terms of arms transfers transparency. The number of states reporting arms imports and exports to the United Nations Register of Conventional Arms (UNROCA) remained low, and while the mandatory reporting under the Arms trade Treaty (ATT) started reasonably well in 2016, a comparison with UNROCA reporting raises questions about whether the two instruments can jointly help to improve overall levels of transparency in the international arms trade. No major changes occurred in transparency at national and regional levels.
The financial value of arms exports, 2015*
Although SIPRI data on arms transfers does not represent their financial value, many arms exporting states do publish figures on the financial value of their arms exports. Based on such data, SIPRI estimates the total value of the global arms trade in 2015 to be at least $91.3 billion. However, the actual figure is likely to be higher.

Developments in the arms industry
Total sales for the arms-producing and military services companies ranked in the SIPRI Top 100 declined for the fifth consecutive year in 2015.* There was a slight decrease of 0.6 per cent compared with 2014. This is the lowest level of annual decline observed since the peak of 2010. The decrease is largely attributable to an overall fall in sales for US-based companies, which continue to dominate the Top 100. Taken together, West European arms producers show increases, some of them linked to significant export sales. Despite sanctions, Russia’s arms industry also grew its arms sales in 2015, mostly due to domestic sales and some exports, while emerging and established producers show mixed results.
A review of 14 years of data on the arms industry confirms that the ranking hierarchy, especially of companies ranked in the top 10, is very stable. It also highlights the fact that despite yearly variations, arms sales for companies ranked at the top and bottom of the SIPRI Top 100 have steadily increased between 2002 and 2015 in constant dollar terms. However, it also shows that the top 10 arms companies’ share of the yearly total revenues of the SIPRI Top 100 has shrunk over the period.
*The latest year for which data is available.
English