The independent resource on global security
Appendix 7A. The suppliers and recipients of major conventional weapons, 2005–2009
Contents
I. Introduction
II. Sources and methods for arms transfers data
Table 7A.1. The recipients of major conventional weapons, 2005–2009
Table 7A.2. The suppliers of major conventional weapons, 2005–2009
Table 7A.3. The 10 largest recipients of major conventional weapons and their suppliers, 2005–2009
Table 7A.4. The 10 largest suppliers of major conventional weapons and their destinations, by region, 2005–2009
Appendix 7A provides data on the suppliers and recipients of major conventional weapons and the size of the international arms trade. Read the full appendix [PDF].
Summary
The trend in transfers of major conventional weapons, 2000–2009
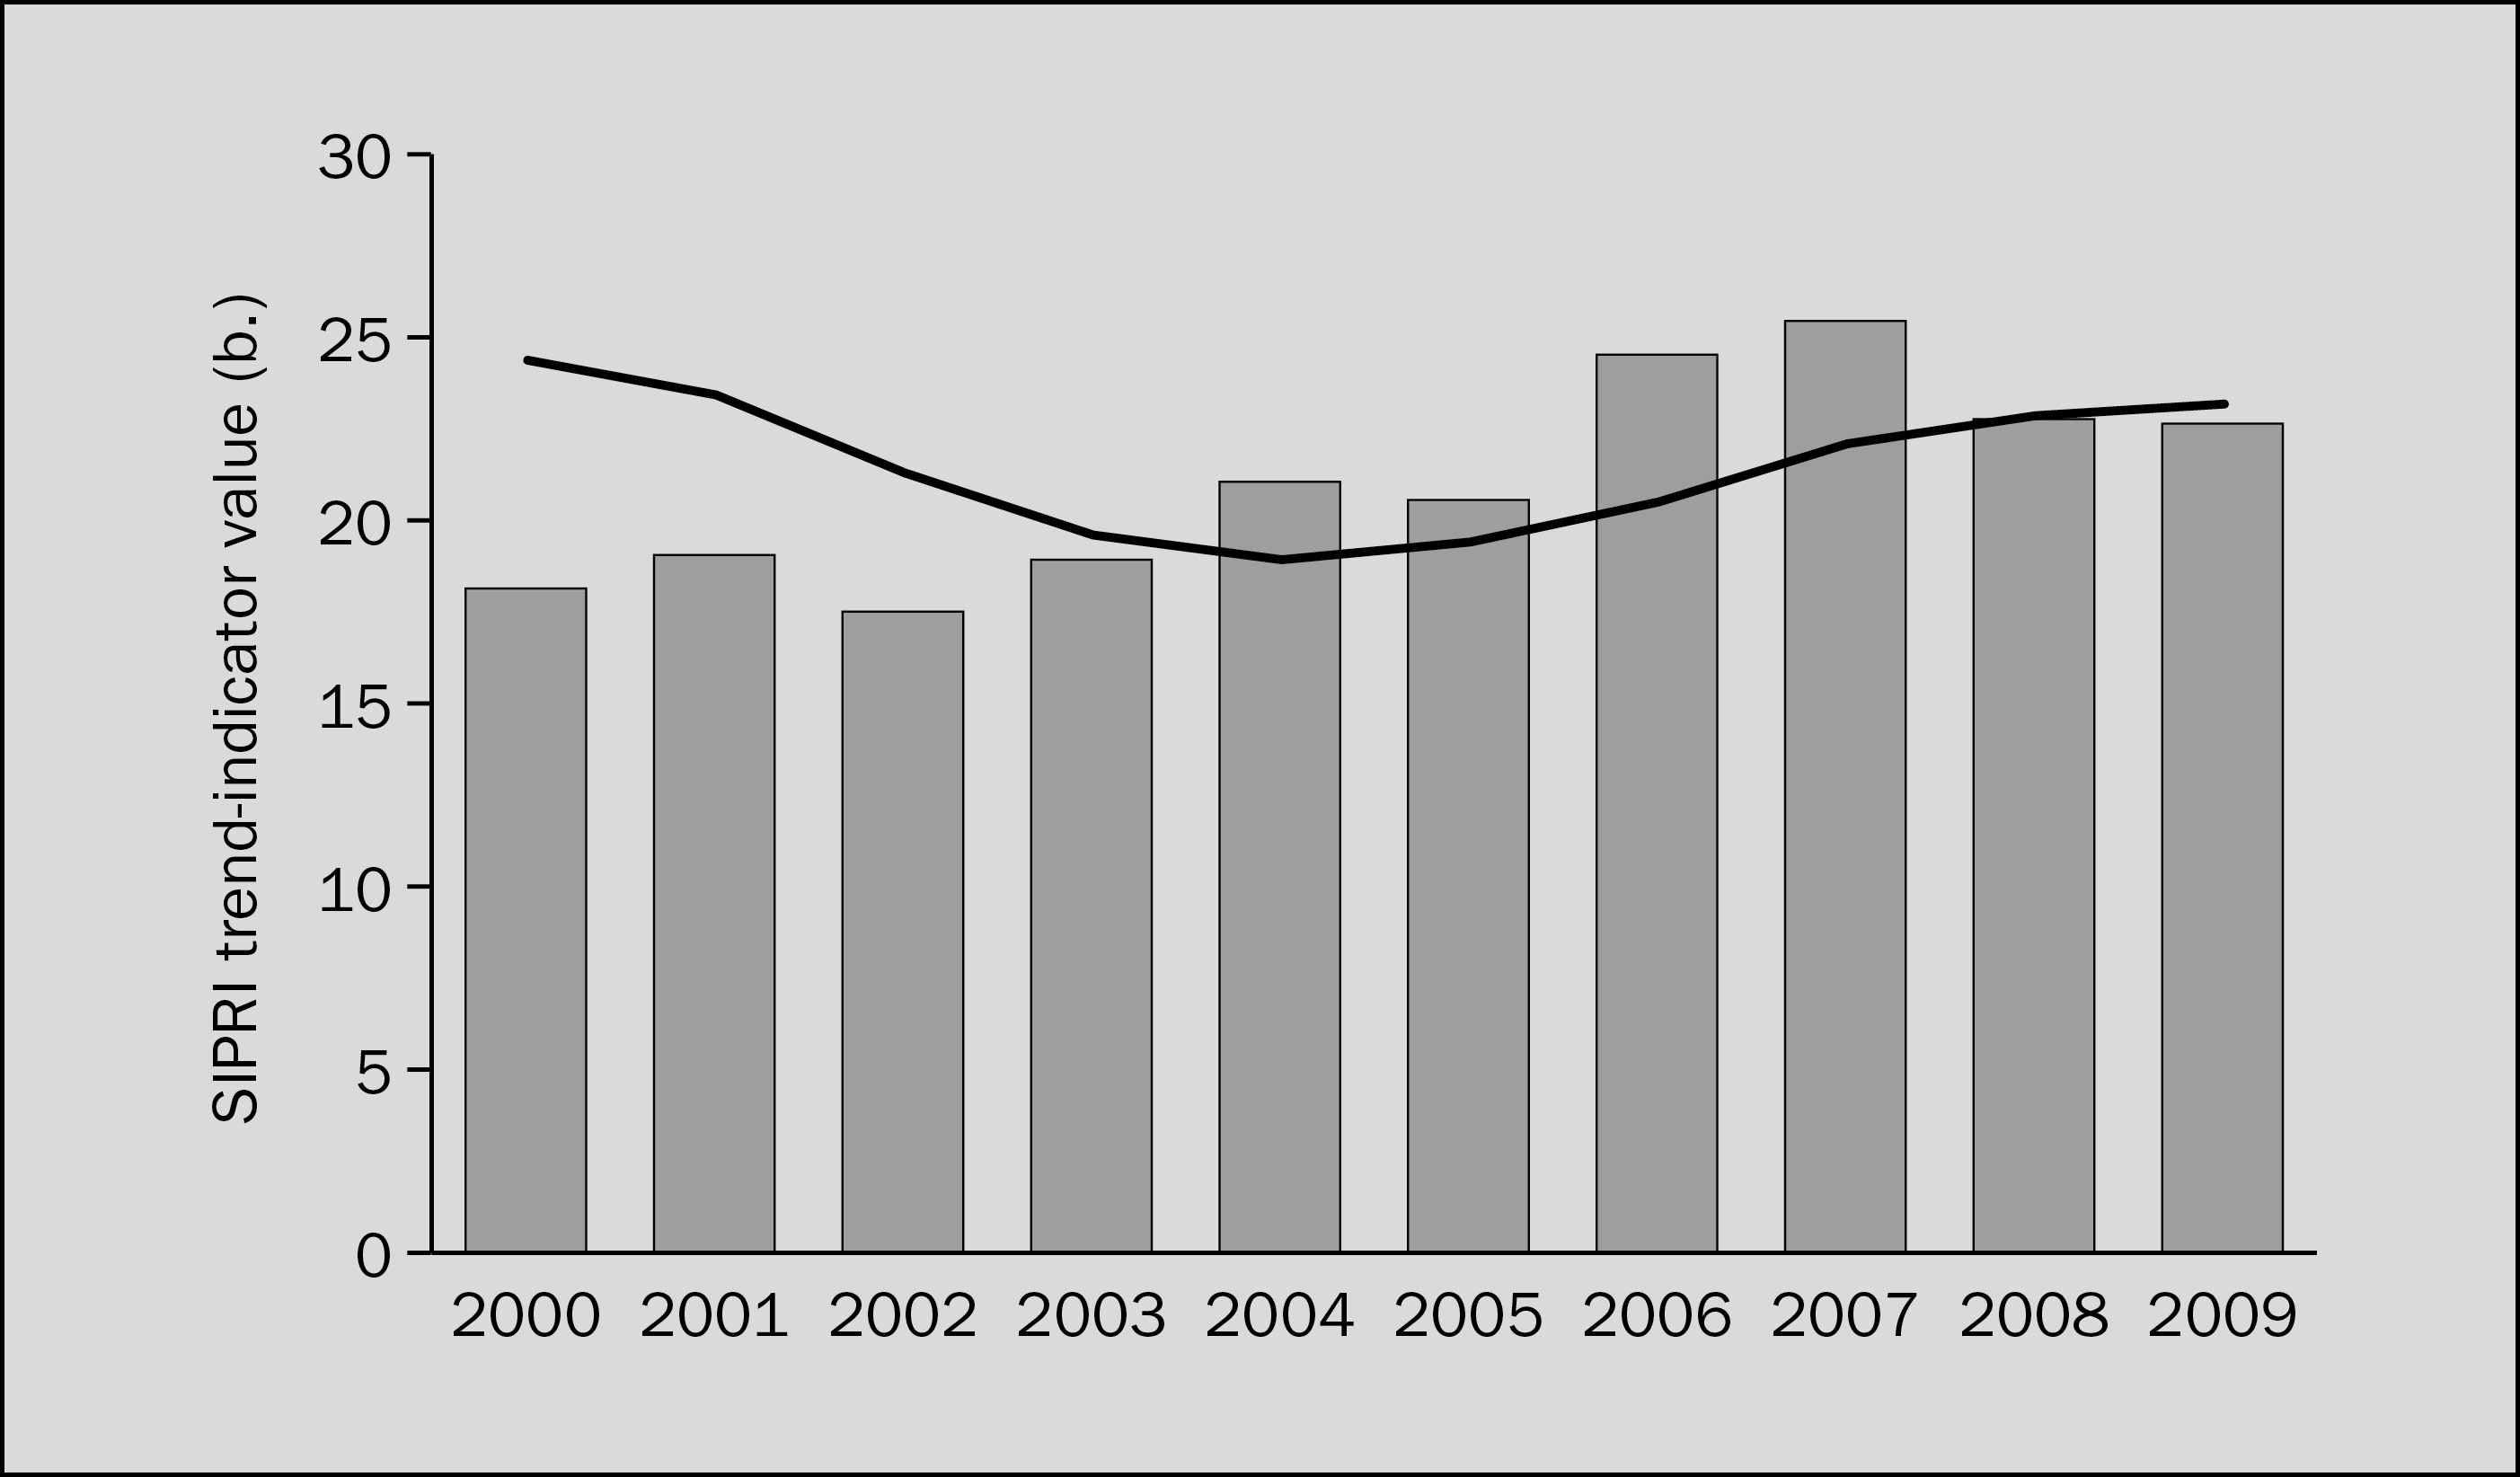
Bar graph: annual totals; line graph: five-year moving average (plotted at the last year of each five-year period).
The five largest suppliers of major conventional weapons, 2005–2009
|
Supplier |
Share of global arms exports (%) |
Main recipients (share of supplier's) transfers) |
|---|---|---|
| USA
|
30
|
South Korea (14%) Israel (11%) UAE (11%) |
| Russia
|
23
|
China (35%) India (24%) Algeria (11%) |
| Germany
|
11
|
Turkey (14%) Greece (13%) South Africa (12%) |
| France
|
8
|
UAE (25%) Singapore (21%) Greece (12%) |
| UK
|
4
|
USA (23%) India (15%) Saudi Arabia (10%) |
The five largest recipients of major conventional weapons, 2005–2009
|
Recipient |
Share of global arms imports (%) |
Main supplier (share of recipient's) transfers) |
|---|---|---|
| China | 9 | Russia (89%) |
| India | 7 | Russia (77%) |
| South Korea | 6 | USA (66%) |
| UAE | 6 | USA (60%) |
| Greece | 4 | Germany (35%) |
This data is obtained from the SIPRI Arms Transfers Database.
English