The independent resource on global security
9. International arms transfers and developments in arms production
Contents
Overview, Siemon T. Wezeman [PDF]
I. Developments in arms transfers, 2016–20, Siemon T. Wezeman, Alexandra Kuimova and Pieter D. Wezeman [PDF]
II. Developments among the suppliers of major arms, 2016–20, Siemon T. Wezeman, Alexandra Kuimova and Pieter D. Wezeman [PDF]
III. Developments among the recipients of major arms, 2016–20, Siemon T. Wezeman, Alexandra Kuimova and Pieter D. Wezeman [PDF]
IV. The financial value of states’ arms exports, Alexandra Marksteiner and Pieter D. Wezeman [PDF]
V. Trends in arms production, 2019, Alexandra Marksteiner [PDF]
The volume of international transfers of major arms in the five-year period 2016–20 was at almost the same level as in 2011–15 and remained at its highest level since the end of the cold war. However, the volume of transfers in 2016–20 was still 35 per cent lower than the peak reached in 1981–85, at the height of the cold war. Overall, the Covid-19 pandemic and the resulting economic crisis appeared to have little effect on arms deliveries in 2020 or on new orders for major arms during the year.
The trend in transfers of major arms, 1950–2020
Suppliers of major arms
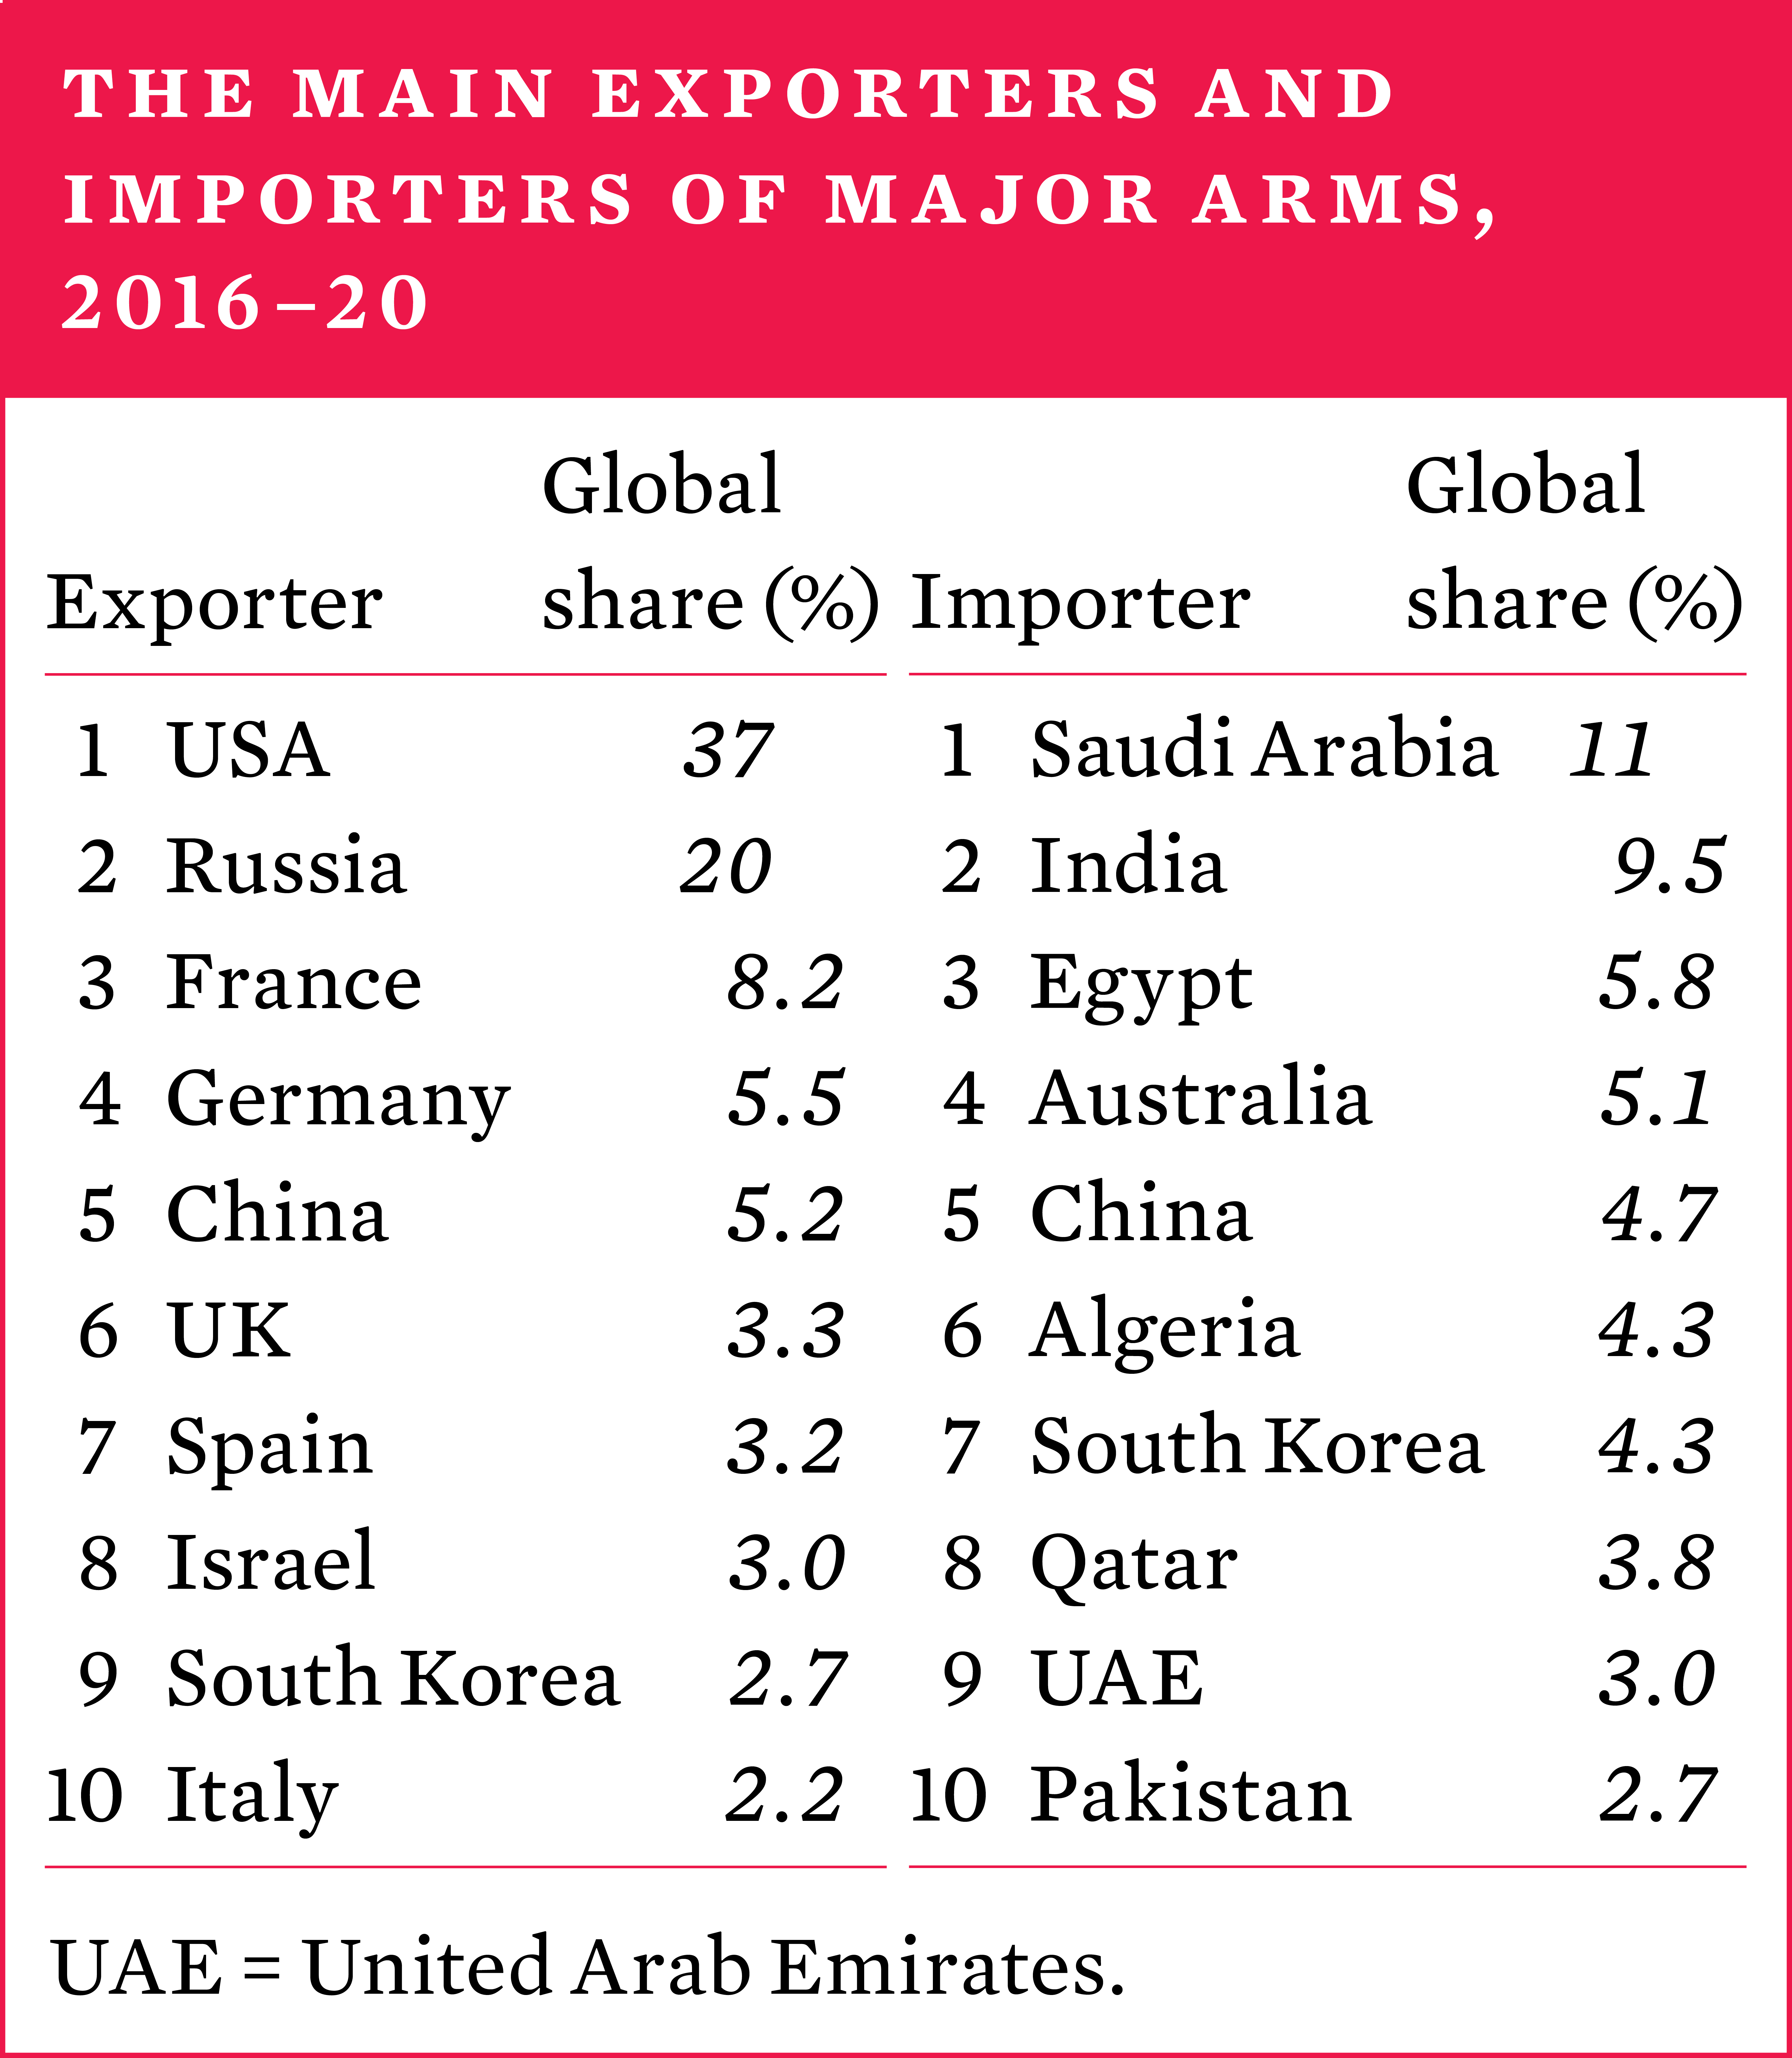
The five largest suppliers in 2016–20—the United States, Russia, France, Germany and China—accounted for 76 per cent of the total volume of exports of major arms. Since 1950, the USA and Russia (or the Soviet Union before 1992) have consistently been by far the largest suppliers. In 2016–20, US arms exports accounted for 37 per cent of the global total and were 15 per cent higher than in 2011–15. Almost half (47 per cent) of US arms exports went to
the Middle East in 2016–20. In contrast, Russia’s arms exports decreased by 22 per cent and its share of the global total dropped from 26 per cent in 2011–15 to
20 per cent in 2016–20.
Arms exports by France (up by 44 per cent) and Germany (up by 21 per cent) grew between 2011–15 and 2016–20, while China’s fell by 7.8 per cent.
Many of the 65 states identified by SIPRI as exporters of major arms in 2016–20 supply only small volumes of arms. The top 25 arms-supplying states accounted for 99 per cent of total global exports. States in North America (i.e. Canada and the USA) and Europe (including Russia) accounted for 86 per cent of all arms exports. The three largest suppliers outside of Europe and North America were China (5.2 per cent of total arms exports), Israel (3.0 per cent) and South Korea (2.7 per cent).
Importers of major arms
SIPRI identified 164 states as importers of major arms in 2016–20. The five largest arms importers were Saudi Arabia, India, Egypt, Australia and China, which together accounted for 36 per cent of total arms imports. The region that received the largest volume of major arms supplies in 2016–20 was Asia and Oceania, accounting for 42 per cent of the global total, followed by the Middle East, which received 33 per cent. The flow of arms to two regions increased between 2011–15 and 2016–20: the Middle East (by 25 per cent) and Europe (by 12 per cent). Meanwhile, flows to the other three regions decreased: Africa (by 13 per cent), the Americas (by 43 per cent) and Asia and Oceania (by 8.3 per cent).
The financial value of states’ arms exports
While SIPRI data on arms transfers does not represent their financial value, many arms-exporting states do publish figures on the financial value of their arms exports. Based on this data, SIPRI estimates that the total value of the global arms trade was at least $118 billion in 2019*.
Arms production and military services
The arms sales of the world’s 25 largest arms-producing and military services companies totalled $361 billion in 2019*— an increase of 8.5 per cent compared with 2018. The 2019 SIPRI ranking is the first to include data for some Chinese arms com-panies. The top 25 arms companies in 2019 are concentrated in North America (12 companies) and Europe (8 companies) but the ranking also includes 4 Chinese companies and 1 from the United Arab Emirates. The top five companies are all based in the USA.
For the first time, SIPRI mapped the international presence of the arms industry, focusing on the 15 largest arms companies in 2019. The data set is made up of 400 foreign entities, defined as branches, subsidiaries and joint ventures registered in a country other than that in which the parent company is headquartered. Taking account of these foreign entities, the reach of the world’s 15 largest arms companies extends across at least 49 different countries.
English