The independent resource on global security
6. International arms transfers
Contents
Overview, Siemon T. Wezeman
I. Global trends in arms transfers, 2018–22, Siemon T. Wezeman and Pieter D. Wezeman
II. Developments among the suppliers of major arms, 2018–22, Siemon T. Wezeman and Pieter D. Wezeman
III. Developments among the recipients of major arms, 2018–22, Siemon T. Wezeman and Pieter D. Wezeman
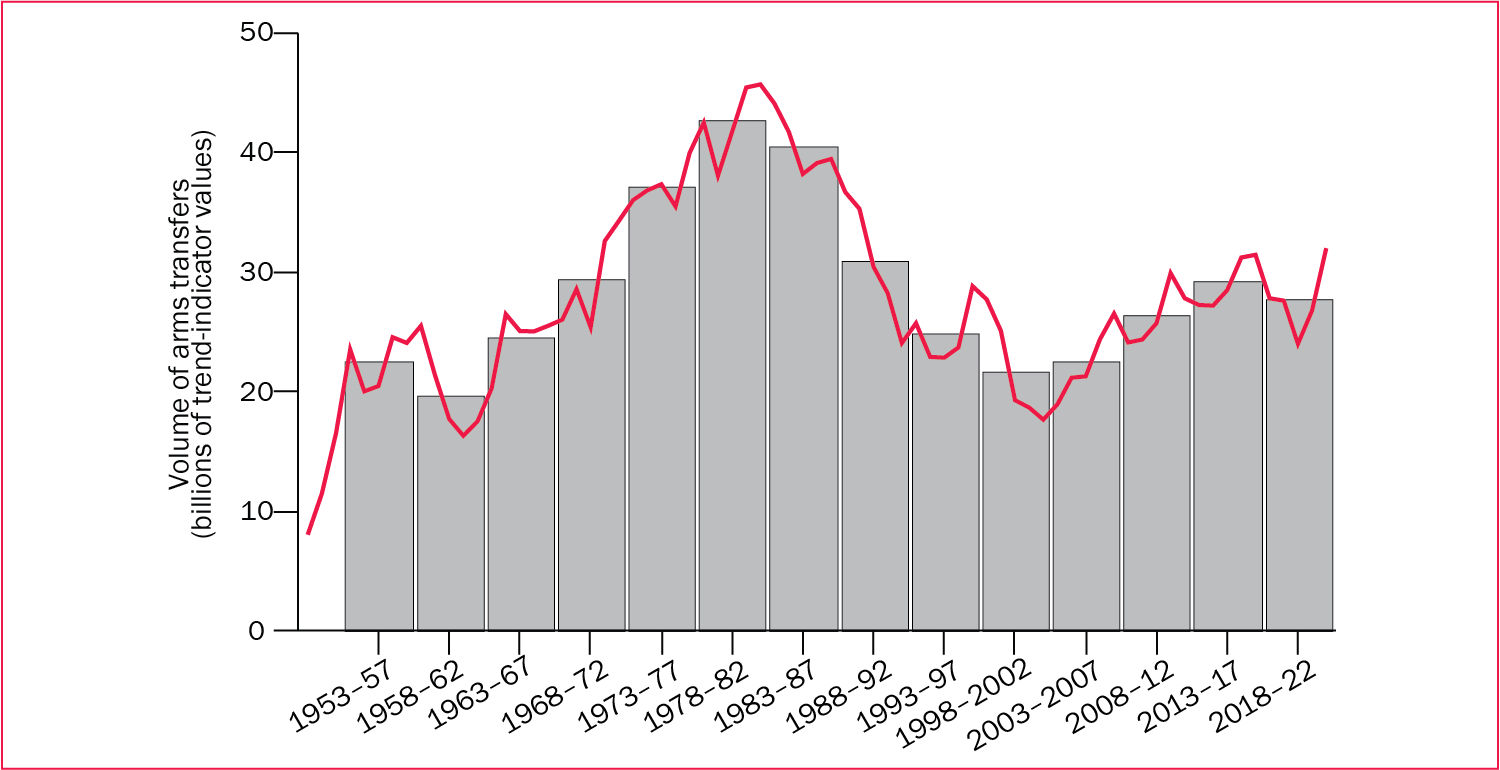
The volume of international transfers of major arms in the five-year period 2018–22 was 5.1 per cent lower than in 2013–17 and 3.9 per cent higher than in 2008–12. The volume of transfers in 2018–22 was among the highest since
the end of the cold war, but was still around 35 per cent lower than the totals for 1978–82 and 1983–87, when arms transfers peaked. States’ arms acquisitions, often from foreign suppliers, are largely driven by armed conflict and political tensions. There are strong indications that tensions are increasing in many regions, most notably in Europe after Russia’s invasion of Ukraine, and it seems highly likely that there will be more demand for major arms in the coming years, much of which will be fulfilled by international transfers.
The trend in transfers of major arms, 1955–2022
Suppliers of major arms
SIPRI has identified 63 states as exporters of major arms in 2018–22, but most are minor exporters. The 25 largest suppliers accounted for 98 per cent of the total volume of exports, and the 5 largest suppliers in the period—the United States, Russia, France, China and Germany—accounted for 76 per cent of the total volume of exports.
Since 1950 the USA and Russia (or the Soviet Union before 1992) have consistently been by far the largest suppliers. However, in 2018–22 the USA consolidated its position as the world’s biggest arms supplier and the gap between it and Russia widened. In 2018–22 the USA’s arms exports were 14 per cent higher than in 2013–17 and its share of the global total increased from 33 to 40 per cent. In contrast, Russia’s arms exports decreased by 31 per cent and its share of the global total dropped from 22 to 16 per cent. Known plans for future deliveries strongly indicate that the gap between the USA and Russia will increase and that, within a few years, Russia may no longer be the second largest supplier of major arms.
Arms exports by France, the third largest supplier, grew by 44 per cent between 2013–17 and 2018–22, while exports by China and Germany decreased by 23 per cent and 35 per cent respectively.
Importers of major arms
SIPRI has identified 167 states as importers of major arms in 2018–22. The five largest arms importers were India, Saudi Arabia, Qatar, Australia and China, which together accounted for 36 per cent of total arms imports. The region that received the largest volume of imports of major arms in 2018–22 was Asia and Oceania, accounting for 41 per cent of the global total, followed by the Middle East (31 per cent), Europe (16 per cent), the Americas (5.8 per cent) and Africa (5.0 per cent). Between 2013–17 and 2018–22, the flow of arms to Europe (+47 per cent) increased, while flows to Africa (–40 per cent), the Americas (–21 per cent), the Middle East (–8.8 per cent), and Asia and Oceania (–7.5 per cent) decreased. Many of the 167 importers are directly involved in armed conflict or in tensions with other states in which the imported major arms play an important role. Many of the exporters are direct stakeholders or participants in at least some of the conflicts and tensions, which partly explains why they are willing to supply arms, even when the supply seems to contradict their stated arms export policies.
The financial value of states’ arms exports
While SIPRI data on arms transfers does not represent their financial value, many arms-exporting states do publish figures on the financial value of their arms exports. Based on this data, SIPRI estimates that the total value of the global arms trade was at least $127 billion in 2021 (the most recent year for which financial data is available), compared with $95 billion (in constant 2021 US dollars) in 2012. The total value of the arms trade in 2021 was about 0.5 per cent of the total value of global international trade in 2021.
English