5. International arms transfers
I. Introduction
II. Global trends in arms transfers, 2020–24
III. Developments among the suppliers of major arms, 2020–24
IV. Developments among the recipients of major arms, 2020–24
V. Conclusions
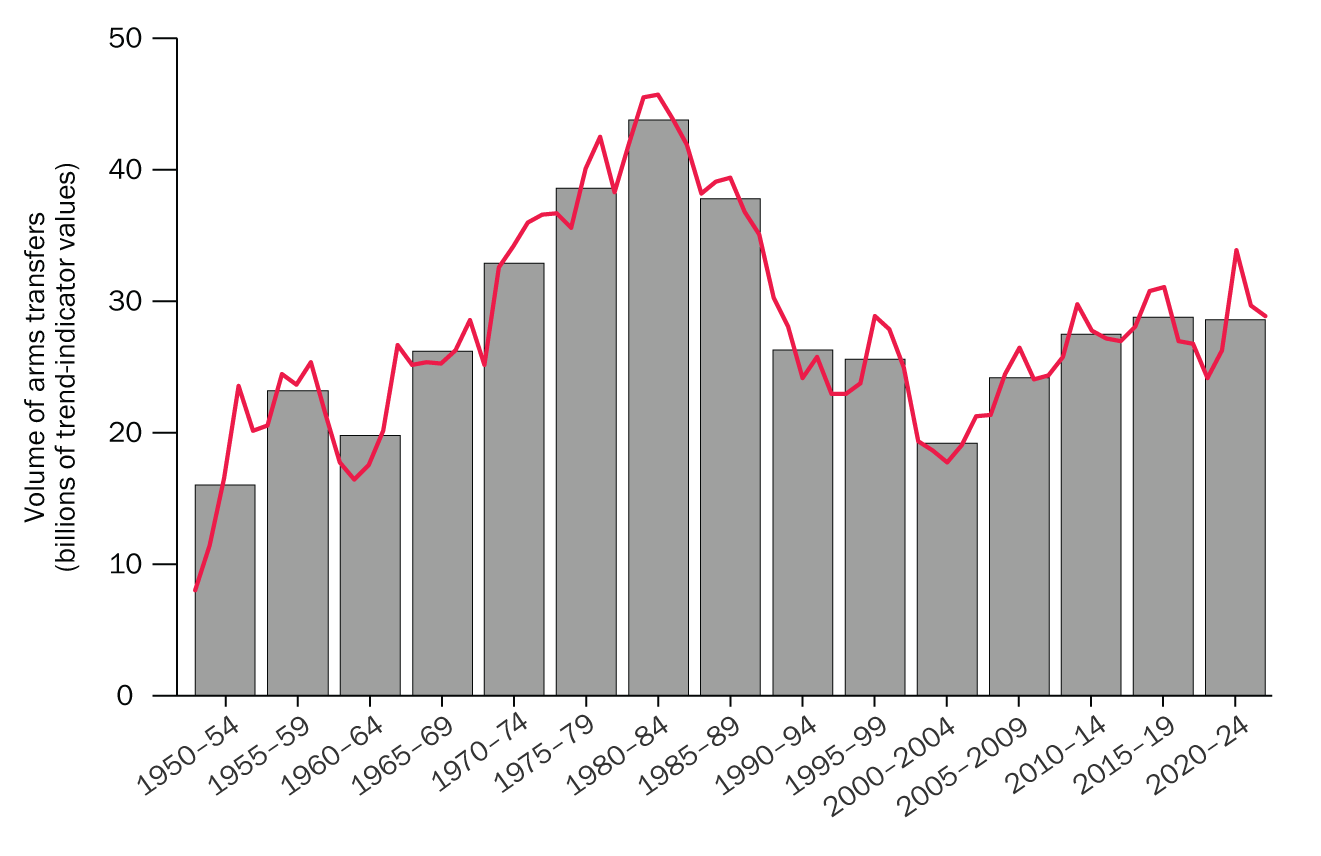
The volume of international transfers of major arms has remained relatively stable over the past 15 years. The volume of transfers in the five-year period 2020–24 was 0.6 per cent lower than in 2015–19 and 3.9 per cent higher than in 2010–14. The volume of transfers in 2020–24 was the second highest of any five-year period since the end of the cold war, but still around 35 per cent lower than the peak years during the cold war (1980–84).
The global trend since 2010–14 perhaps goes against expectations, coming at a time when armed conflicts and threat perceptions in many parts of the world have intensified, resulting in widespread increases in arms procurement. Three key factors, among many others, have kept international arms transfers at around the same level over the past 15 years: long procurement cycles, expanding domestic arms production and economic constraints. However, the stable overall trend masks a far more complex regional picture and there are indications, which became more visible in 2020–24, that the volume of international arms transfers will grow in the coming years.
The trend in transfers of major arms, 1950–2024
Conflicts, tensions and arms transfers
Armed conflicts and increasing interstate tensions are the main drivers of arms acquisitions for many states. Most of
the largest recipients of major arms in 2020–24 used imported arms in military combat operations in that period. Many arms suppliers are direct stakeholders in at least some of the conflicts or are affected by related tensions. This partly explains why they are willing to supply arms, even when the transfers seem to contradict their stated arms export policies. Three non-state armed groups were identified as recipients of major arms in 2020–24, located in Lebanon/Palestine, Libya and Yemen.
Suppliers of major arms
SIPRI has identified 64 states as suppliers of major arms in 2020–24, but most are minor suppliers. The 25 largest suppliers accounted for 98 per cent of the total volume of exports, and the top five—the United States, France, Russia, China and Germany—accounted for 71 per cent.
The USA’s arms exports grew by 21 per cent between 2015–19 and 2020–24, increasing its share of global arms exports from 35 to 43 per cent. Known plans for deliveries of major arms over the next few years strongly indicate that the USA will remain unchallenged as the world’s largest arms supplier for the foreseeable future—a position leading to anxieties of depend-ence for some of its main clients and allies. In contrast, Russia’s arms exports halved between 2015–19 and 2020–24 to a level far below any previous five-year period in its history (or in any previous five-year period since 1950 for its predecessor, the Soviet Union). Exports by France rose by 11 per cent between 2015–19 and 2020–24, making France the second largest supplier of major arms in 2020–24.
Recipients of major arms
SIPRI has identified 162 states as recipients of major arms in 2020–24. The five largest arms recipients were Ukraine, India, Qatar, Saudi Arabia and Pakistan, which together accounted for 35 per cent of total arms imports. Ukraine’s arms imports increased nearly 100 times over compared with 2015–19, with at least 35 states delivering major arms, mostly as aid.
China, for decades among the top arms recipients, saw arms imports fall by two thirds between 2015–19 and 2020–24 as it continued to expand its domestic arms production capabilities.
The region that received the largest volume of transfers of major arms in 2020–24 was Asia and Oceania. States in Asia and Oceania accounted for 33 per cent of all global arms transfers, followed by those in Europe (28 per cent), the Middle East (27 per cent), the Americas (6.2 per cent) and finally Africa (4.5 per cent). Between 2015–19 and 2020–24, the flow of arms to Europe increased by 155 per cent, reaching a level far higher than in any of the six preceding five-year periods. The flow to the Americas also increased (+13 per cent), while flows to Africa (−44 per cent), Asia and Oceania (−21 per cent) and the Middle East (−20 per cent) decreased.
